> ## Documentation Index
> Fetch the complete documentation index at: https://docs.traffical.io/llms.txt
> Use this file to discover all available pages before exploring further.
# Layers & policies in the dashboard
> Managing layers and reading the policy detail page — the verdict banner, its seven tabs, measurement progress, and per-policy analysis settings.
The **Layers** page is where every experiment, rollout, and feature-flag policy lives. Layers keep concurrent experiments cleanly separated; policies decide who sees what within a layer. This page walks the dashboard surfaces — for the underlying model, see [Layers](/concepts/layers) and [Policies](/concepts/policies).
 ## The layer list
Each card is a [layer](/concepts/layers) with its policies at a glance:
* Name and description, with the protected **Base** layer pinned first — it carries config-as-code parameter defaults and can't be deleted
* How many policies are active, running, and adaptive, plus completed and archived counts
* The top policies by priority with their state and traffic share
Filter chips narrow the list — **All**, **Has Running**, **All Draft**, **Adaptive** — and search matches layer and policy names. **Create Layer** adds a new one. Group parameters that are tested together in the same layer.
## Layer detail
A layer's page centers on its policies.
## The layer list
Each card is a [layer](/concepts/layers) with its policies at a glance:
* Name and description, with the protected **Base** layer pinned first — it carries config-as-code parameter defaults and can't be deleted
* How many policies are active, running, and adaptive, plus completed and archived counts
* The top policies by priority with their state and traffic share
Filter chips narrow the list — **All**, **Has Running**, **All Draft**, **Adaptive** — and search matches layer and policy names. **Create Layer** adds a new one. Group parameters that are tested together in the same layer.
## Layer detail
A layer's page centers on its policies.
 ### Policies list
Active policies are ordered by priority — when a user is eligible for more than one, the highest-priority eligible policy applies. Drag a row's handle to reorder; the top policy has the highest priority. Each row shows:
* Name, state (draft / running / paused), and kind (static / adaptive)
* An eligibility badge when the policy is restricted to a bucket range
* Allocation count, traffic share, and the algorithm for adaptive policies
* A live mini allocation bar for running policies
**Completed** and **Archived** policies collapse into their own sections below the active list. Archive a draft or completed policy from its row menu to tidy the list; unarchive restores it at any time, with history intact.
### Swim-lanes view
**Policy Bucket Overview** draws every active policy as a lane across the layer's bucket space, so you can see which bucket ranges each policy claims — and where eligible ranges overlap. Overlaps are flagged explicitly: when two policies draw from the same buckets, the higher-priority one wins for the shared users.
## Creating a policy
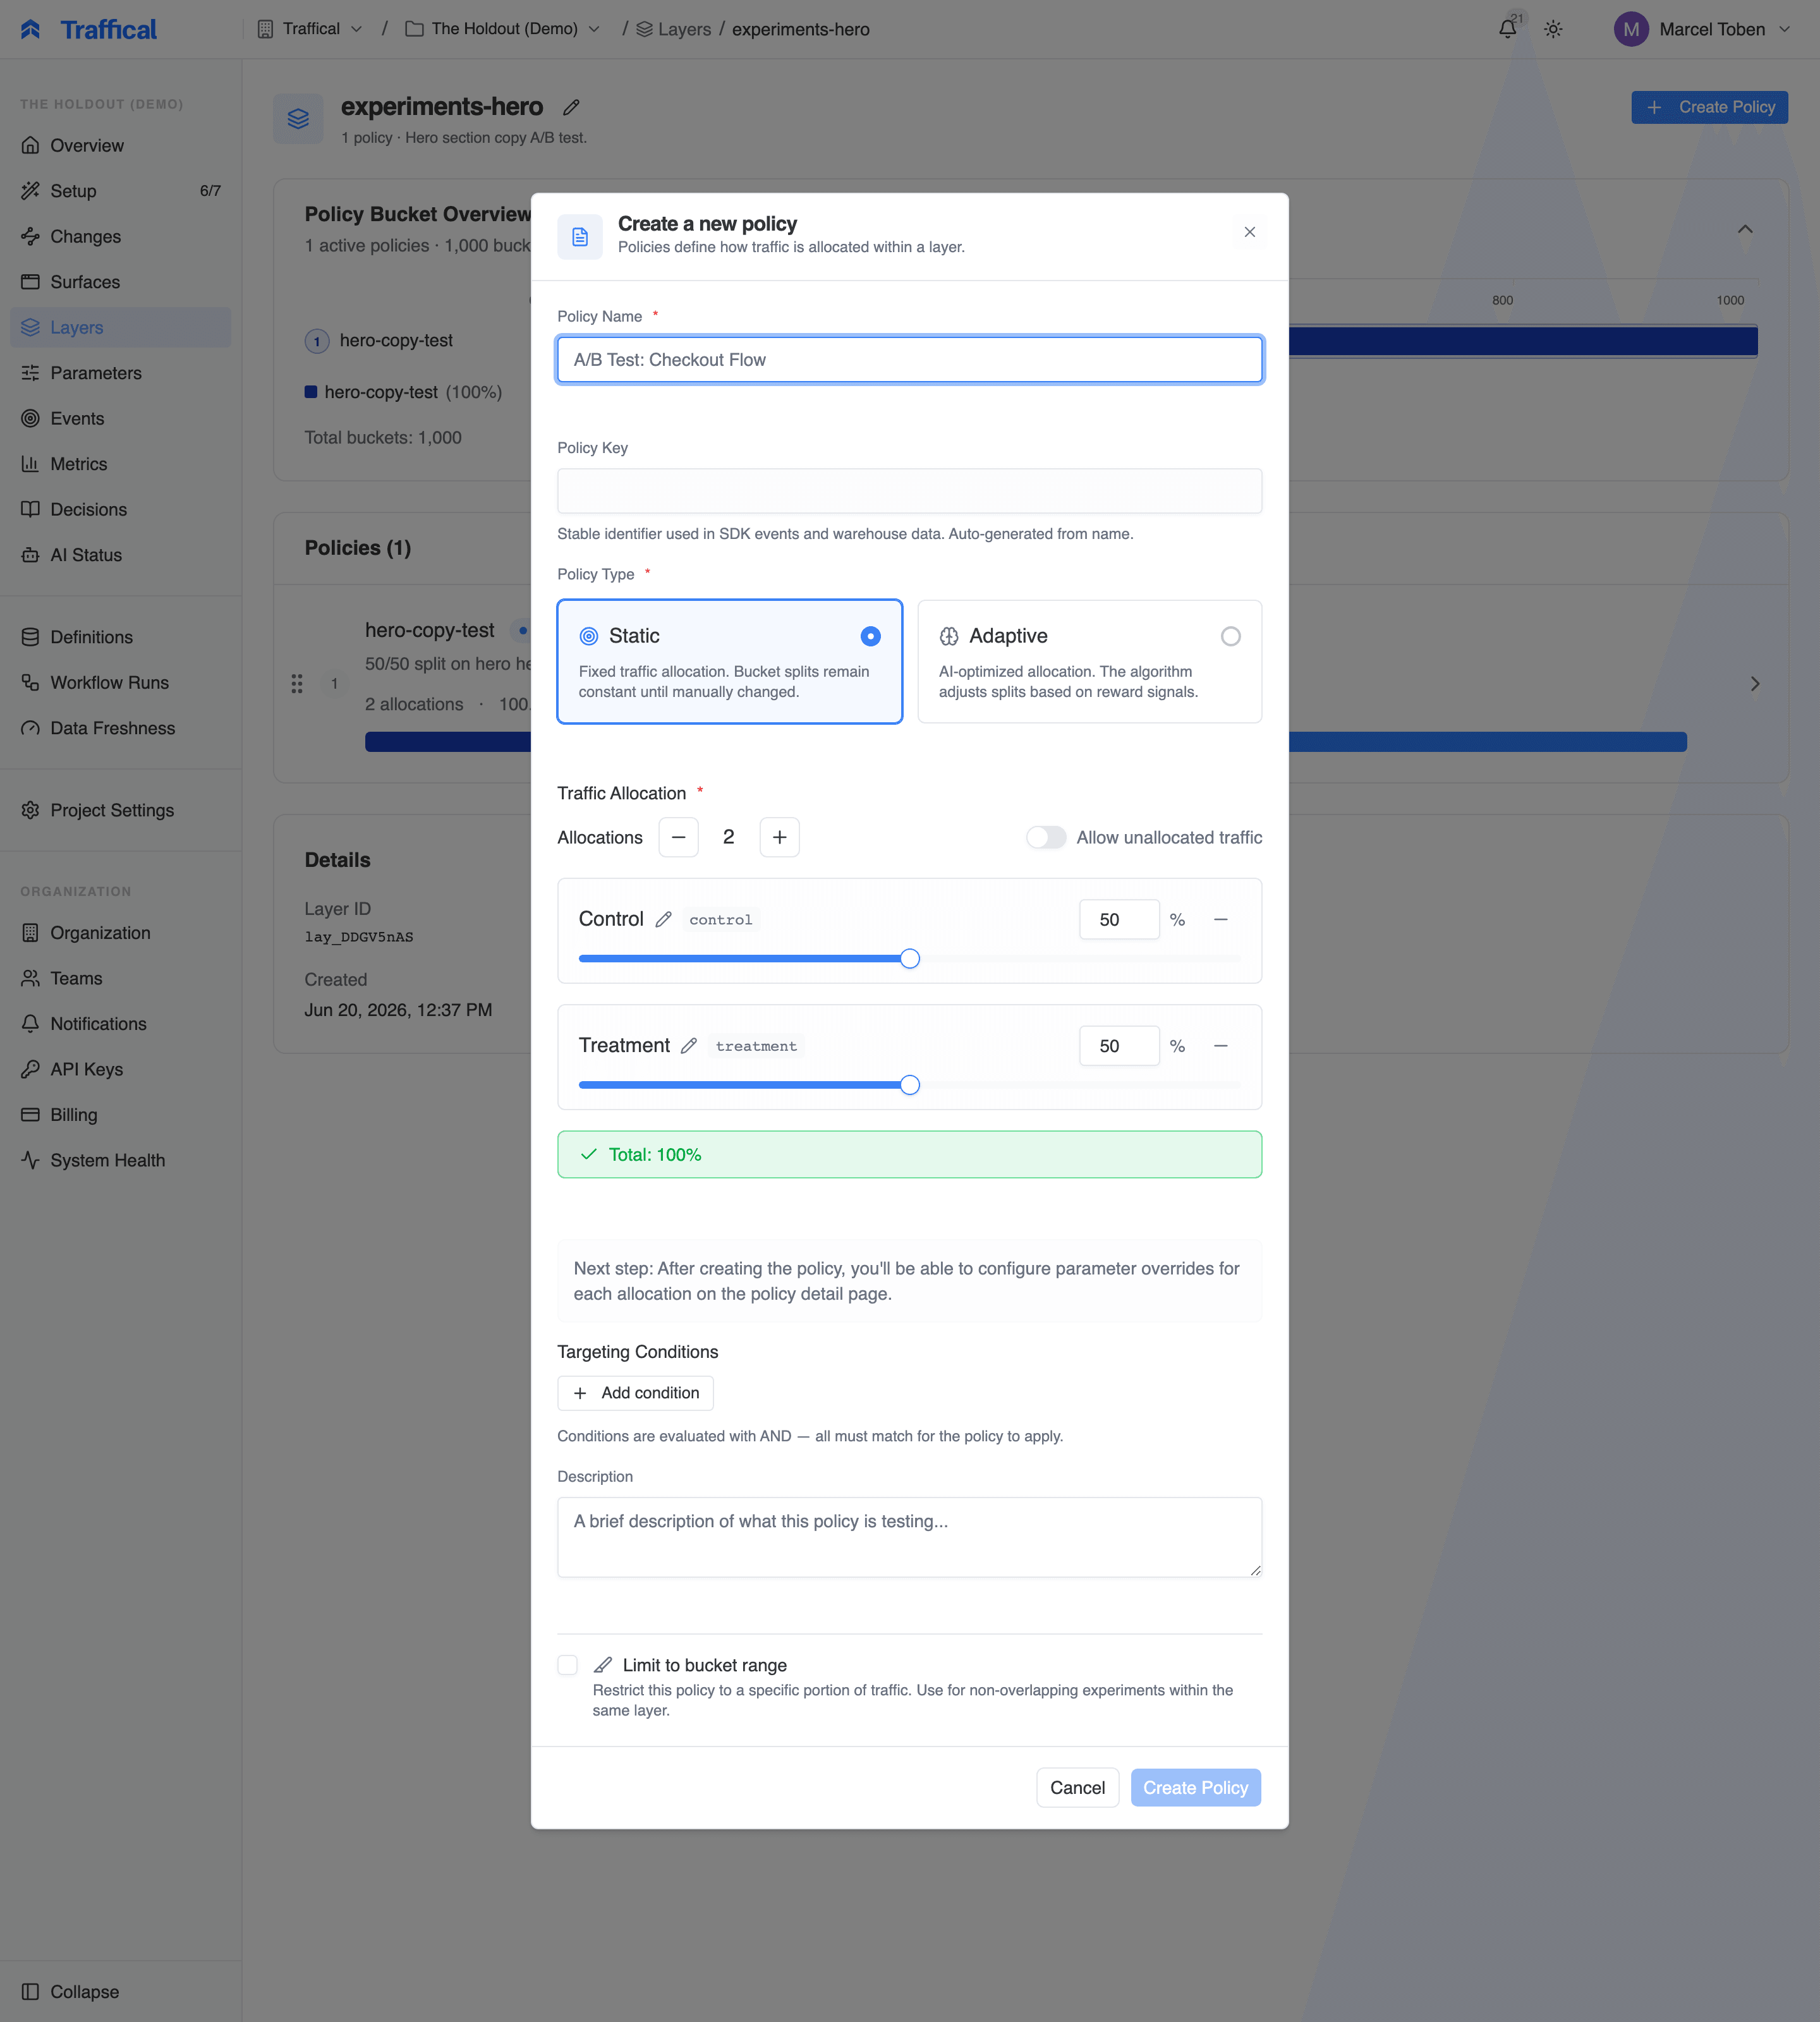
**Create Policy** opens a modal for the essentials: name, an auto-generated key (the stable identifier used in SDK events and warehouse assignment data), kind, the traffic allocation — defaulting to a 50/50 Control / Treatment split — the optimization goal for adaptive policies, optional targeting conditions, and optionally an eligible bucket range. The policy is created in **draft** — you configure parameter overrides for each allocation (and can refine splits and targeting) on its detail page before starting it. Creating and editing policies requires a role with policy write access — see [Roles and permissions](/governance/roles-and-permissions).
### Policies list
Active policies are ordered by priority — when a user is eligible for more than one, the highest-priority eligible policy applies. Drag a row's handle to reorder; the top policy has the highest priority. Each row shows:
* Name, state (draft / running / paused), and kind (static / adaptive)
* An eligibility badge when the policy is restricted to a bucket range
* Allocation count, traffic share, and the algorithm for adaptive policies
* A live mini allocation bar for running policies
**Completed** and **Archived** policies collapse into their own sections below the active list. Archive a draft or completed policy from its row menu to tidy the list; unarchive restores it at any time, with history intact.
### Swim-lanes view
**Policy Bucket Overview** draws every active policy as a lane across the layer's bucket space, so you can see which bucket ranges each policy claims — and where eligible ranges overlap. Overlaps are flagged explicitly: when two policies draw from the same buckets, the higher-priority one wins for the shared users.
## Creating a policy
**Create Policy** opens a modal for the essentials: name, an auto-generated key (the stable identifier used in SDK events and warehouse assignment data), kind, the traffic allocation — defaulting to a 50/50 Control / Treatment split — the optimization goal for adaptive policies, optional targeting conditions, and optionally an eligible bucket range. The policy is created in **draft** — you configure parameter overrides for each allocation (and can refine splits and targeting) on its detail page before starting it. Creating and editing policies requires a role with policy write access — see [Roles and permissions](/governance/roles-and-permissions).
 ### Choosing the goal
Adaptive policies declare what they optimize in one of two modes:
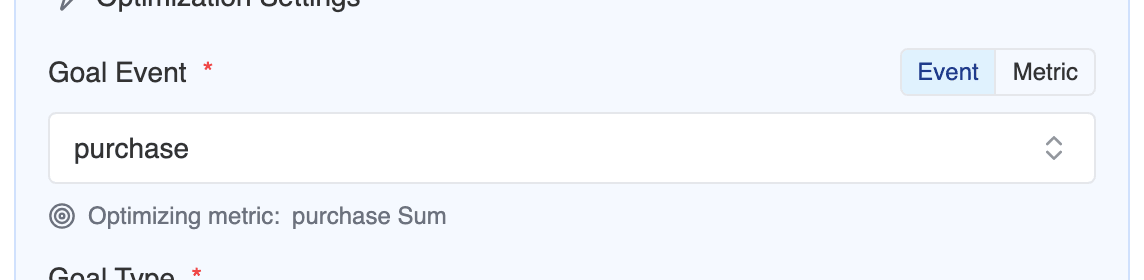
* **Event mode** — pick a goal event and a goal type: **Conversion Rate**, **Sum**, or **Count** (how the event aggregates per user). The selector previews the metric this resolves to — *Optimizing metric: checkout\_completed Conversion Rate* — so the reward contract is explicit at authoring time.
* **Metric mode** — pick a goal metric directly from the project's warehouse-native metrics (conversion rate, count, sum, or composite). The goal type follows the metric, certified metrics are labeled, and a metric with a **decrease** desired direction is *minimized* — the optimizer treats a drop as a win.
### Choosing the goal
Adaptive policies declare what they optimize in one of two modes:
* **Event mode** — pick a goal event and a goal type: **Conversion Rate**, **Sum**, or **Count** (how the event aggregates per user). The selector previews the metric this resolves to — *Optimizing metric: checkout\_completed Conversion Rate* — so the reward contract is explicit at authoring time.
* **Metric mode** — pick a goal metric directly from the project's warehouse-native metrics (conversion rate, count, sum, or composite). The goal type follows the metric, certified metrics are labeled, and a metric with a **decrease** desired direction is *minimized* — the optimizer treats a drop as a win.
 Projects with event definitions default to event mode and can toggle between the two. Warehouse-only projects (no event definitions) always pick a metric — see [Warehouse-native mode](/concepts/warehouse-native) and [Metrics](/dashboard/metrics).
## The policy detail page
The header carries the policy's name, state, kind, and rollout status, plus the actions ([below](#policy-actions)). Policies are often governed through a [change](/concepts/changes) — a banner links to the owning change, and standalone policies offer **Convert to change**. That lifecycle, including [approval and autonomy rules](/governance/approvals-and-autonomy), is covered in [Changes in the dashboard](/dashboard/changes), so it isn't repeated here.
Everything else is organized into seven tabs:
| Tab | What it answers |
| --------------- | ------------------------------------------------------------------------------------ |
| **Overview** | Where does the experiment stand right now? |
| **Setup** | How is it configured — splits, parameters, measurement targets? |
| **Measurement** | What do the measured results say, and how far along is the experiment? |
| **Diagnostics** | Is it serving correctly? Flagged `(!)` while any health check is warning or failing. |
| **Decisions** | What was decided, when, by whom, and why? |
| **History** | How did allocations, rollout steps, and configuration evolve? |
| **Settings** | Policy key, per-policy analysis overrides, targeting. |
Projects with event definitions default to event mode and can toggle between the two. Warehouse-only projects (no event definitions) always pick a metric — see [Warehouse-native mode](/concepts/warehouse-native) and [Metrics](/dashboard/metrics).
## The policy detail page
The header carries the policy's name, state, kind, and rollout status, plus the actions ([below](#policy-actions)). Policies are often governed through a [change](/concepts/changes) — a banner links to the owning change, and standalone policies offer **Convert to change**. That lifecycle, including [approval and autonomy rules](/governance/approvals-and-autonomy), is covered in [Changes in the dashboard](/dashboard/changes), so it isn't repeated here.
Everything else is organized into seven tabs:
| Tab | What it answers |
| --------------- | ------------------------------------------------------------------------------------ |
| **Overview** | Where does the experiment stand right now? |
| **Setup** | How is it configured — splits, parameters, measurement targets? |
| **Measurement** | What do the measured results say, and how far along is the experiment? |
| **Diagnostics** | Is it serving correctly? Flagged `(!)` while any health check is warning or failing. |
| **Decisions** | What was decided, when, by whom, and why? |
| **History** | How did allocations, rollout steps, and configuration evolve? |
| **Settings** | Policy key, per-policy analysis overrides, targeting. |
 ## The verdict banner
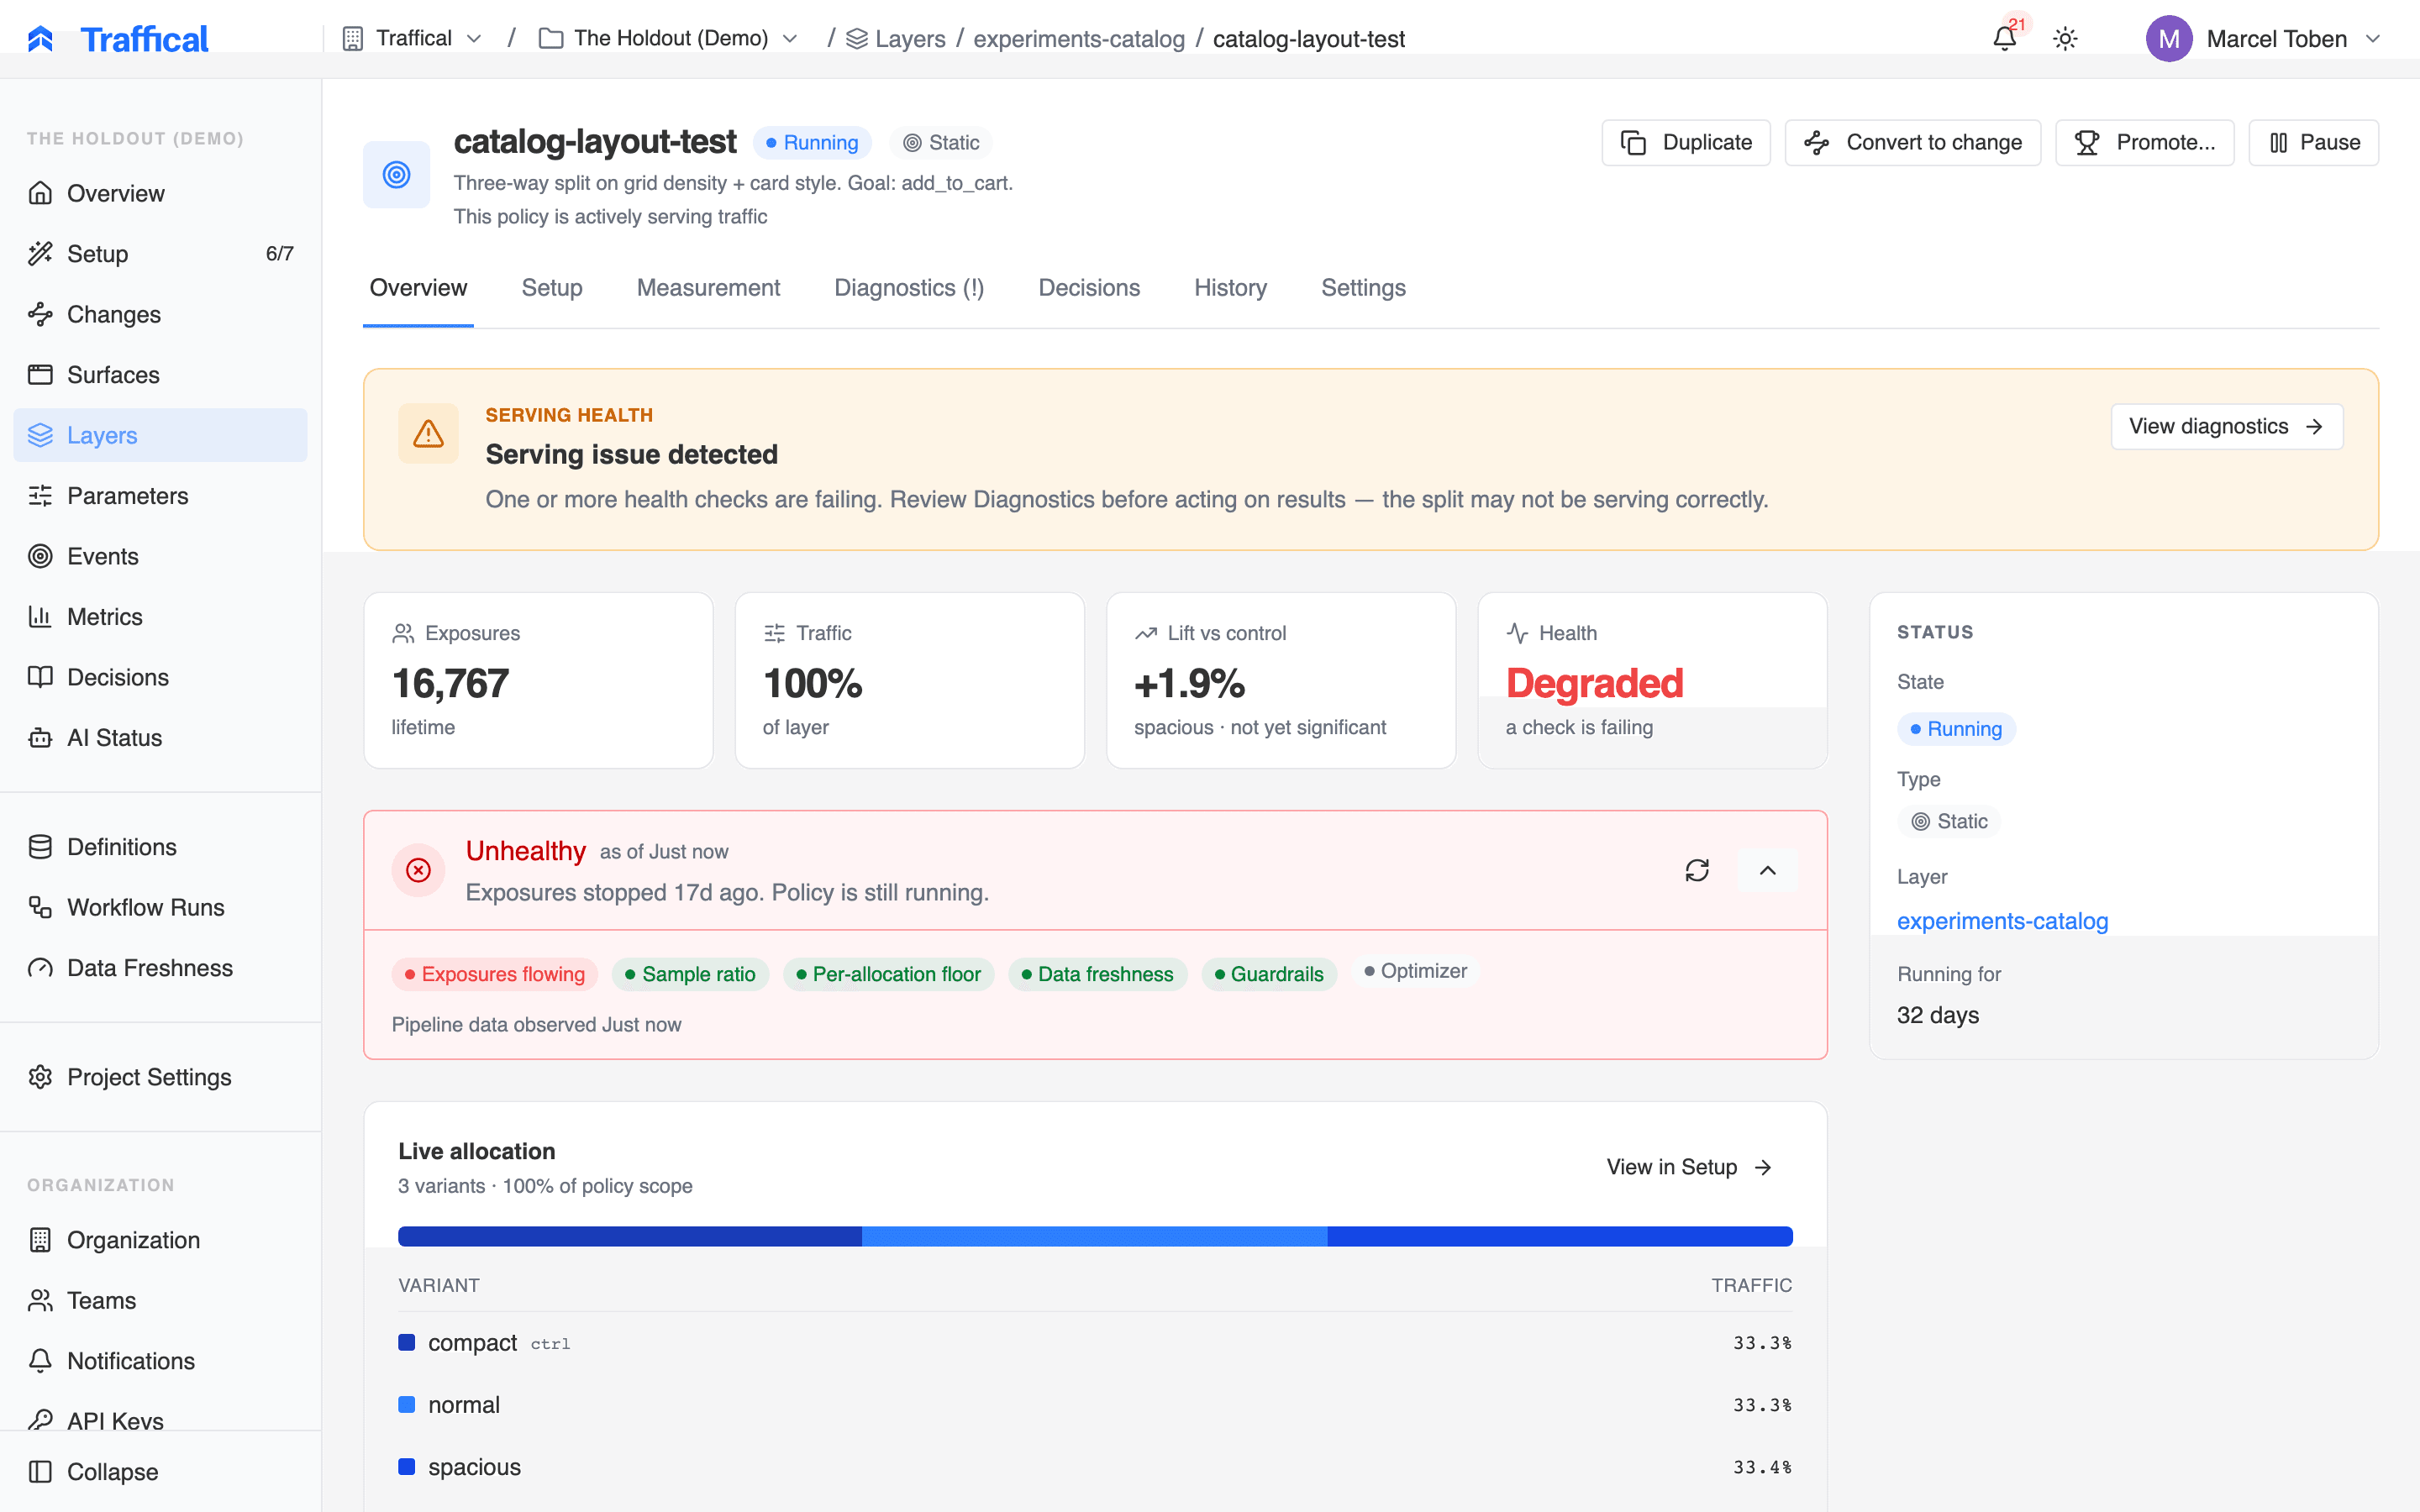
A running policy opens with one plainly stated verdict. It is derived from real signals — serving health, the optimizer's convergence, and the measured primary metric — and follows a strict precedence:
1. **Completed outcome.** A completed policy states its result — "*checkout\_v2* won" — with the final lift.
2. **Health breach.** While any health check is failing, the banner reads **"Serving issue detected"** and points you to Diagnostics. No win is claimed and promotion is suppressed — the split may not be serving correctly, so results can't be trusted yet.
3. **Winner.** An adaptive policy whose optimizer has converged on a leader, or a static policy with a statistically significant measured winner.
4. **Still learning.** No significant winner yet — the banner names the trending variant, if any, and tells you to keep running.
The banner is deliberately honest about the standard of evidence. When a primary metric is attached, **measured significance** — not the optimizer's posterior — decides what counts as a win:
* A bandit leader whose measured lift isn't yet significant reads "***X* is winning traffic**", not "*X* is winning". Winning traffic is what the optimizer did; winning is a measured verdict.
* **Promote** is offered only when it's safe: it's withheld while health is degraded or while measured significance is pending, with the banner telling you to resolve the health warning or keep running first.
* Only without a primary metric attached does the optimizer's convergence alone carry the verdict.
For static policies the measured primary metric *is* the verdict: the winner is the best challenger that is significant in the metric's desired direction, trending results are labeled "not statistically conclusive yet", and when control is ahead the banner says so.
## Overview tab
A **draft** policy's Overview shows a launch-readiness checklist, the planned traffic allocation, and a configuration summary — everything to review before starting.
Once running, the Overview answers "where does this stand" without a tab switch:
* **KPI band** — four numbers: lifetime **Exposures**, **Traffic** (the share of the layer's buckets the policy's allocations cover), **Lift vs control**, and **Health**. With a primary metric attached, the lift KPI shows the *measured* lift of the best challenger; it stays uncolored and flagged "not yet significant" until the result is conclusive, and the sign of a win follows the metric's desired direction. Without a metric it falls back to the optimizer's estimate.
* **Serving health** — the compact health summary; each check opens its history. See [Policy health](/dashboard/policy-health).
* **Live allocation** — the current split bar plus a per-variant digest: traffic share, exposures, and average reward or conversion rate for adaptive policies, with the leader badged. Completed policies show the final split.
* **Primary metric strip** — measured results per variant against control with confidence-interval bars. This is the same snapshot the Measurement tab renders, kept separate from the optimizer's learning signal so measured truth and bandit estimates never blur into one card.
* **Rollout progress** while a rollout is ramping, and — on completed policies — a **How it closed** card with the closing decision record.
## Setup tab
Setup is the configuration home:
* **Configuration** — algorithm, goal, minimum exposures before traffic shifts, and context fields for contextual policies. Editable while in draft.
* **Splits & parameters** — the allocation bar (toggle between policy scope and layer scope) and the per-allocation parameter override editor. Once a policy starts, splits and overrides are **locked** for assignment stability — the optimizer owns the live split. Duplicate the policy to iterate.
* **Measurement targets** — the resolved target MDE per attached metric, each with a source badge showing where the value came from (policy override, metric default, project default, or assumed). Targets stamped by a [measurement protocol](/governance/measurement-protocols) are locked and change only through a protocol amendment. Guardrail metrics target their threshold instead — no MDE needed.
* A rail summarizes the rollout configuration (ramp, status, on-violation behavior) and the model for adaptive policies.
## Measurement tab
Measurement is where you read results.
## The verdict banner
A running policy opens with one plainly stated verdict. It is derived from real signals — serving health, the optimizer's convergence, and the measured primary metric — and follows a strict precedence:
1. **Completed outcome.** A completed policy states its result — "*checkout\_v2* won" — with the final lift.
2. **Health breach.** While any health check is failing, the banner reads **"Serving issue detected"** and points you to Diagnostics. No win is claimed and promotion is suppressed — the split may not be serving correctly, so results can't be trusted yet.
3. **Winner.** An adaptive policy whose optimizer has converged on a leader, or a static policy with a statistically significant measured winner.
4. **Still learning.** No significant winner yet — the banner names the trending variant, if any, and tells you to keep running.
The banner is deliberately honest about the standard of evidence. When a primary metric is attached, **measured significance** — not the optimizer's posterior — decides what counts as a win:
* A bandit leader whose measured lift isn't yet significant reads "***X* is winning traffic**", not "*X* is winning". Winning traffic is what the optimizer did; winning is a measured verdict.
* **Promote** is offered only when it's safe: it's withheld while health is degraded or while measured significance is pending, with the banner telling you to resolve the health warning or keep running first.
* Only without a primary metric attached does the optimizer's convergence alone carry the verdict.
For static policies the measured primary metric *is* the verdict: the winner is the best challenger that is significant in the metric's desired direction, trending results are labeled "not statistically conclusive yet", and when control is ahead the banner says so.
## Overview tab
A **draft** policy's Overview shows a launch-readiness checklist, the planned traffic allocation, and a configuration summary — everything to review before starting.
Once running, the Overview answers "where does this stand" without a tab switch:
* **KPI band** — four numbers: lifetime **Exposures**, **Traffic** (the share of the layer's buckets the policy's allocations cover), **Lift vs control**, and **Health**. With a primary metric attached, the lift KPI shows the *measured* lift of the best challenger; it stays uncolored and flagged "not yet significant" until the result is conclusive, and the sign of a win follows the metric's desired direction. Without a metric it falls back to the optimizer's estimate.
* **Serving health** — the compact health summary; each check opens its history. See [Policy health](/dashboard/policy-health).
* **Live allocation** — the current split bar plus a per-variant digest: traffic share, exposures, and average reward or conversion rate for adaptive policies, with the leader badged. Completed policies show the final split.
* **Primary metric strip** — measured results per variant against control with confidence-interval bars. This is the same snapshot the Measurement tab renders, kept separate from the optimizer's learning signal so measured truth and bandit estimates never blur into one card.
* **Rollout progress** while a rollout is ramping, and — on completed policies — a **How it closed** card with the closing decision record.
## Setup tab
Setup is the configuration home:
* **Configuration** — algorithm, goal, minimum exposures before traffic shifts, and context fields for contextual policies. Editable while in draft.
* **Splits & parameters** — the allocation bar (toggle between policy scope and layer scope) and the per-allocation parameter override editor. Once a policy starts, splits and overrides are **locked** for assignment stability — the optimizer owns the live split. Duplicate the policy to iterate.
* **Measurement targets** — the resolved target MDE per attached metric, each with a source badge showing where the value came from (policy override, metric default, project default, or assumed). Targets stamped by a [measurement protocol](/governance/measurement-protocols) are locked and change only through a protocol amendment. Guardrail metrics target their threshold instead — no MDE needed.
* A rail summarizes the rollout configuration (ramp, status, on-violation behavior) and the model for adaptive policies.
## Measurement tab
Measurement is where you read results.
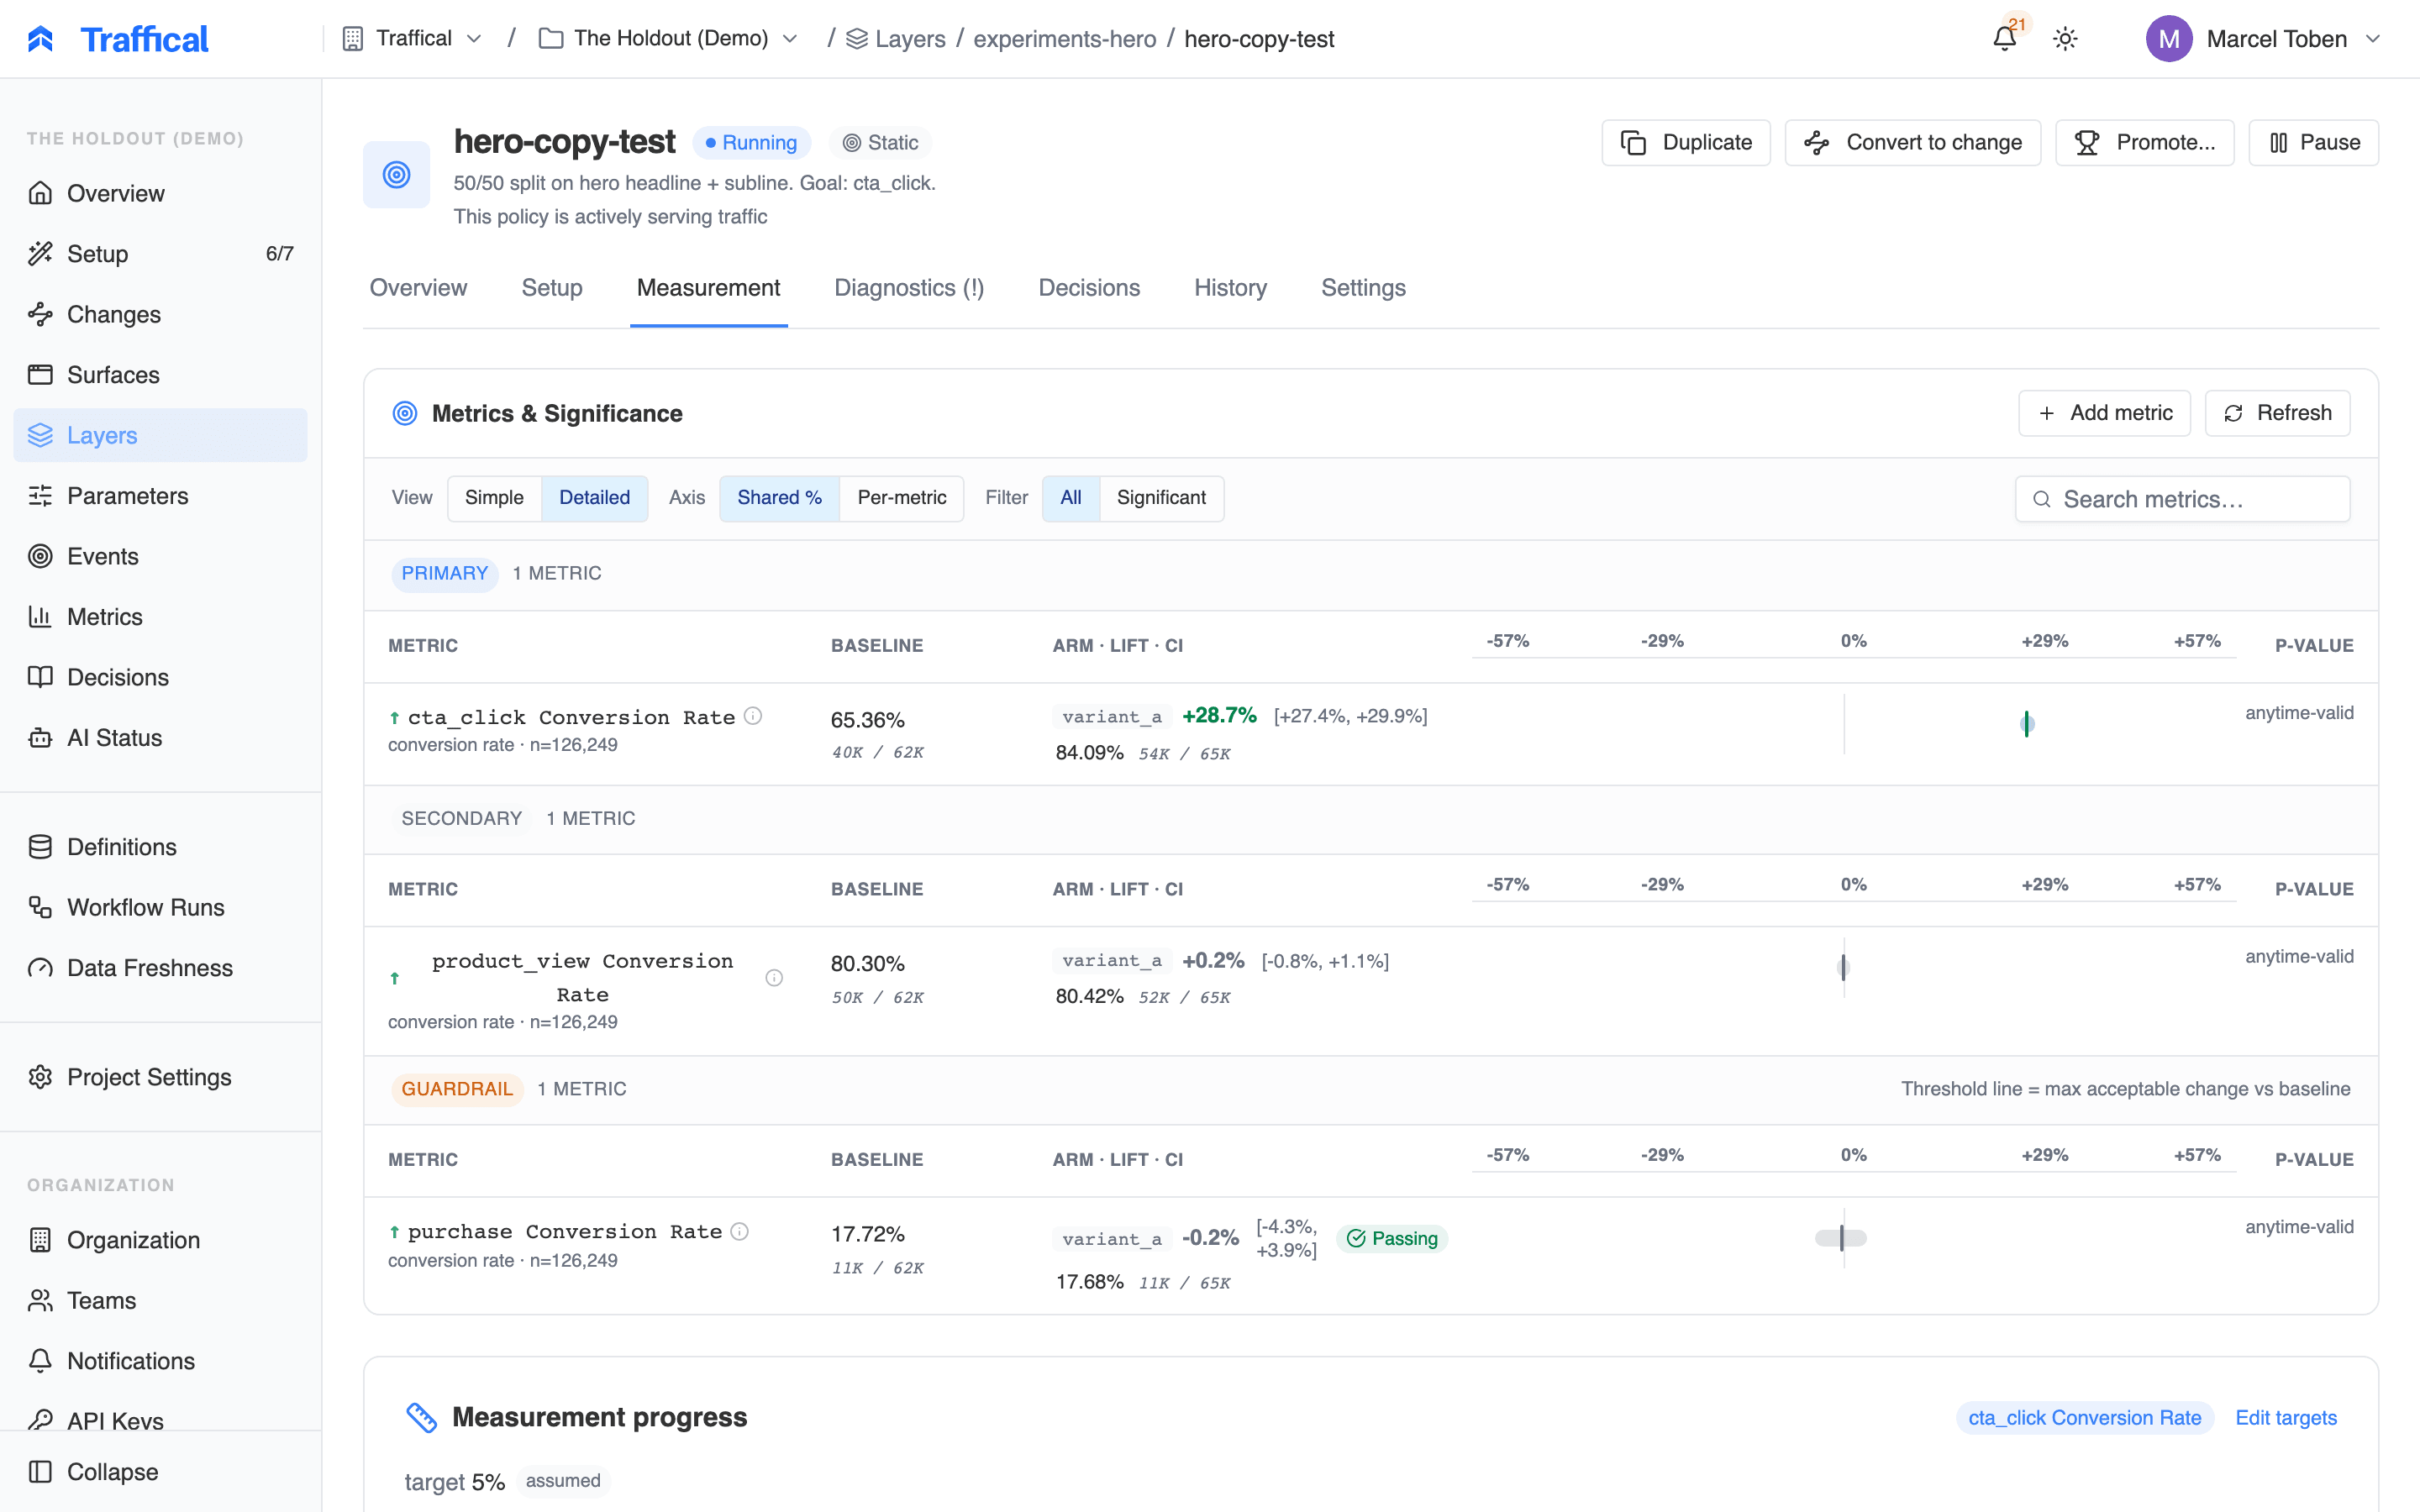 The **results panel** lists every attached metric with per-variant point estimates, confidence intervals, and significance — see [Significance](/statistics/significance) for how the numbers are computed and [Metrics](/dashboard/metrics) for attaching them.
If an adaptive policy optimizes a goal event but has no metric attached yet, the tab offers a bridge instead: **create a conversion-rate metric from the goal event** in one click (or attach an existing metric) to get statistical significance with confidence intervals on top of the optimization signal.
Adaptive policies also get their model behavior here: the optimization status panel, a convergence readout (exploring → learning → converging → converged), and the per-arm learning state. The converged advice applies the same standard of evidence as the verdict banner — once the optimizer converges, the tab only suggests completing the policy if the leader's measured lift is significant; otherwise it says to keep running until it reaches significance. Per-entity policies show how many entities are being independently optimized and which variant wins across them; contextual policies show training status and per-context model behavior instead.
### Measurement progress
The **measurement progress card** tracks how close the experiment is to its target minimum detectable effect:
* The target MDE with its source, a progress bar, and a **Target reached** terminal state
* **Detectable now** — the effect size the current sample could reliably detect, converging toward the target
* An estimated time remaining with its as-of time — or an honest "no traffic accruing recently" when nothing is arriving
* For static tests with more than two arms, the limiting arm that gates overall progress
* For adaptive policies, progress is measured on the leader-vs-control pair — the comparison that actually gates completion; contextual policies get no runtime estimate, since winners vary per context
Paused policies freeze the estimates; completed policies show a retrospective ("this experiment could reliably detect effects of ±2.1% or larger"). Draft policies get a what-if planner instead: enter a baseline rate and target MDE to see the required sample per variant before launching. The math behind all of this is covered in [Measurement progress](/statistics/measurement-progress).
## Diagnostics tab
Diagnostics answers "is it serving correctly":
* **Health checks** as clickable pills — each opens its per-window history
* The **assignments chart** — exposures and traffic share over a selectable window
* For static policies, an **SRM history** chart tracking sample-ratio mismatch over time
* **Recent transitions** — every per-check pass / warn / fail change
The tab label carries a `(!)` whenever health is anything other than healthy — a warning is enough to flag it, not only a failing check. The checks themselves are documented in [Policy health](/dashboard/policy-health); if a check is failing, see [Troubleshooting](/reference/troubleshooting).
## Decisions tab
A timeline of decision records for this policy: state transitions are captured automatically, promotions record their outcome (winner selected, inconclusive, reverted, …) with reason and tags, and **Add Annotation** lets you record checkpoints and context manually. This is the same data as the project-wide [decision log](/dashboard/decisions), scoped to one policy.
## History tab
History is the raw evolution record:
* **Rollout history** — every ramp step with from/to percentage, trigger (auto, scheduled, manual), and the health status at that step
* **Optimization run log** — each optimizer evaluation for adaptive policies
* **Allocation history** — how the split moved over time as the engine learned
* **Change history** — the configuration activity log
## Settings tab
* **Policy key** — copy the stable identifier used in SDK events and in your warehouse `policyKey` column mapping.
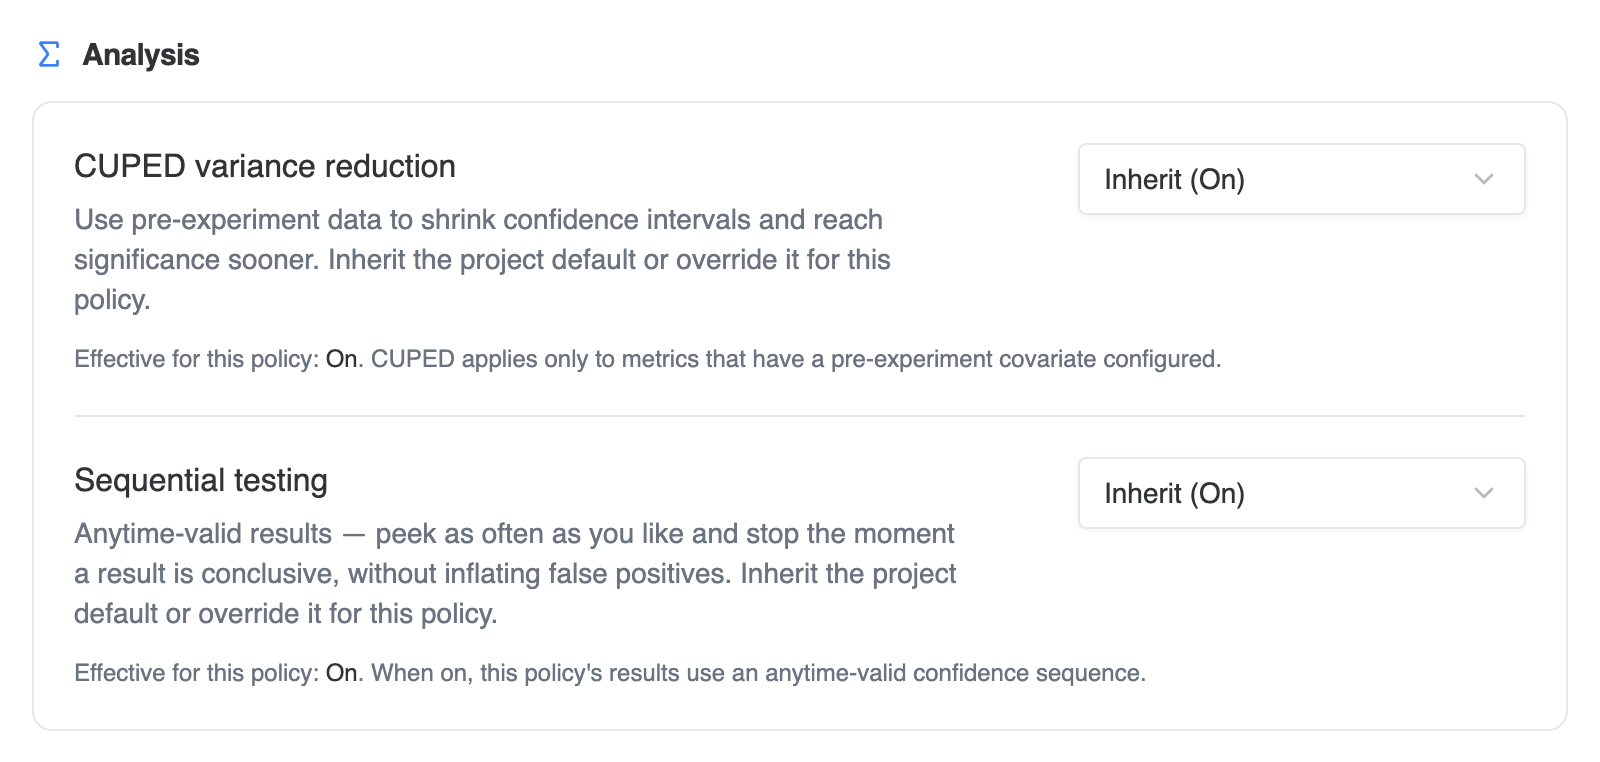
* **Analysis** — per-policy overrides for **CUPED variance reduction** and **sequential testing**. Each is a three-way choice: *Inherit project default*, *Enabled*, or *Disabled*, with the effective value spelled out ("Inherit (On)"). The effective rule is policy setting if set, otherwise the project default — see [CUPED](/statistics/cuped) and [Sequential testing](/statistics/sequential-testing).
* **Bucket range** — a readout of the eligible bucket range and the traffic portion it represents.
* **Targeting conditions** — the eligibility rules, matched against the context your SDK passes at decision time. Conditions are combined with AND and editable while in draft; see [targeting conditions](/concepts/policies#targeting-conditions) for the operators.
The **results panel** lists every attached metric with per-variant point estimates, confidence intervals, and significance — see [Significance](/statistics/significance) for how the numbers are computed and [Metrics](/dashboard/metrics) for attaching them.
If an adaptive policy optimizes a goal event but has no metric attached yet, the tab offers a bridge instead: **create a conversion-rate metric from the goal event** in one click (or attach an existing metric) to get statistical significance with confidence intervals on top of the optimization signal.
Adaptive policies also get their model behavior here: the optimization status panel, a convergence readout (exploring → learning → converging → converged), and the per-arm learning state. The converged advice applies the same standard of evidence as the verdict banner — once the optimizer converges, the tab only suggests completing the policy if the leader's measured lift is significant; otherwise it says to keep running until it reaches significance. Per-entity policies show how many entities are being independently optimized and which variant wins across them; contextual policies show training status and per-context model behavior instead.
### Measurement progress
The **measurement progress card** tracks how close the experiment is to its target minimum detectable effect:
* The target MDE with its source, a progress bar, and a **Target reached** terminal state
* **Detectable now** — the effect size the current sample could reliably detect, converging toward the target
* An estimated time remaining with its as-of time — or an honest "no traffic accruing recently" when nothing is arriving
* For static tests with more than two arms, the limiting arm that gates overall progress
* For adaptive policies, progress is measured on the leader-vs-control pair — the comparison that actually gates completion; contextual policies get no runtime estimate, since winners vary per context
Paused policies freeze the estimates; completed policies show a retrospective ("this experiment could reliably detect effects of ±2.1% or larger"). Draft policies get a what-if planner instead: enter a baseline rate and target MDE to see the required sample per variant before launching. The math behind all of this is covered in [Measurement progress](/statistics/measurement-progress).
## Diagnostics tab
Diagnostics answers "is it serving correctly":
* **Health checks** as clickable pills — each opens its per-window history
* The **assignments chart** — exposures and traffic share over a selectable window
* For static policies, an **SRM history** chart tracking sample-ratio mismatch over time
* **Recent transitions** — every per-check pass / warn / fail change
The tab label carries a `(!)` whenever health is anything other than healthy — a warning is enough to flag it, not only a failing check. The checks themselves are documented in [Policy health](/dashboard/policy-health); if a check is failing, see [Troubleshooting](/reference/troubleshooting).
## Decisions tab
A timeline of decision records for this policy: state transitions are captured automatically, promotions record their outcome (winner selected, inconclusive, reverted, …) with reason and tags, and **Add Annotation** lets you record checkpoints and context manually. This is the same data as the project-wide [decision log](/dashboard/decisions), scoped to one policy.
## History tab
History is the raw evolution record:
* **Rollout history** — every ramp step with from/to percentage, trigger (auto, scheduled, manual), and the health status at that step
* **Optimization run log** — each optimizer evaluation for adaptive policies
* **Allocation history** — how the split moved over time as the engine learned
* **Change history** — the configuration activity log
## Settings tab
* **Policy key** — copy the stable identifier used in SDK events and in your warehouse `policyKey` column mapping.
* **Analysis** — per-policy overrides for **CUPED variance reduction** and **sequential testing**. Each is a three-way choice: *Inherit project default*, *Enabled*, or *Disabled*, with the effective value spelled out ("Inherit (On)"). The effective rule is policy setting if set, otherwise the project default — see [CUPED](/statistics/cuped) and [Sequential testing](/statistics/sequential-testing).
* **Bucket range** — a readout of the eligible bucket range and the traffic portion it represents.
* **Targeting conditions** — the eligibility rules, matched against the context your SDK passes at decision time. Conditions are combined with AND and editable while in draft; see [targeting conditions](/concepts/policies#targeting-conditions) for the operators.
 ## Policy actions
From the header you can:
* **Start / Pause / Complete** — completing is final: the policy stops being evaluated and its results are preserved.
* **Promote…** — available on running policies with two or more allocations and no active rollout, and from the completed verdict banner. Promoting creates a *new* static draft policy serving the winning variant, with a rollout pre-configured to complete the source policy when it finishes — so the winner ships behind health gates. It writes a decision record to the source policy's timeline.
* **Duplicate** — fork the configuration into a new draft. This is the way to iterate, since splits and overrides lock once a policy starts.
* **Convert to change** — wrap a standalone policy in a [change](/concepts/changes).
* **Configure Rollout** — attach a progressive rollout while in draft; see [Rollouts](/experimentation/rollouts).
* **Archive** — draft and completed policies only.
## Tips
* **Always start in draft.** Build out the allocations and conditions, then start when you're ready. Switching state is fast; a misconfigured running policy is a panic.
* **Use the eligible bucket range** for non-overlapping experiments rather than separate layers. Layers are for parameters; ranges are for sub-segments of the same layer. The swim-lanes view shows you exactly what overlaps.
* **Attach a primary metric to adaptive policies.** Without one, the optimizer's posterior is the only signal and no measured verdict gates promotion. With one, you get the full standard of evidence.
* **Name allocations descriptively.** `control` and `treatment` are conventional, but `low_price_5` is more useful than `treatment_b` six months later.
## Next steps
Walking through a static policy end-to-end.
Adaptive algorithms, contextual bandits, per-entity bandits.
The math behind targets, detectable effects, and runtime estimates.
Diagnostics for running policies: SRM, freshness, guardrails.
The audit trail of every policy lifecycle action.
How concluded decision records roll up into reported impact.
## Policy actions
From the header you can:
* **Start / Pause / Complete** — completing is final: the policy stops being evaluated and its results are preserved.
* **Promote…** — available on running policies with two or more allocations and no active rollout, and from the completed verdict banner. Promoting creates a *new* static draft policy serving the winning variant, with a rollout pre-configured to complete the source policy when it finishes — so the winner ships behind health gates. It writes a decision record to the source policy's timeline.
* **Duplicate** — fork the configuration into a new draft. This is the way to iterate, since splits and overrides lock once a policy starts.
* **Convert to change** — wrap a standalone policy in a [change](/concepts/changes).
* **Configure Rollout** — attach a progressive rollout while in draft; see [Rollouts](/experimentation/rollouts).
* **Archive** — draft and completed policies only.
## Tips
* **Always start in draft.** Build out the allocations and conditions, then start when you're ready. Switching state is fast; a misconfigured running policy is a panic.
* **Use the eligible bucket range** for non-overlapping experiments rather than separate layers. Layers are for parameters; ranges are for sub-segments of the same layer. The swim-lanes view shows you exactly what overlaps.
* **Attach a primary metric to adaptive policies.** Without one, the optimizer's posterior is the only signal and no measured verdict gates promotion. With one, you get the full standard of evidence.
* **Name allocations descriptively.** `control` and `treatment` are conventional, but `low_price_5` is more useful than `treatment_b` six months later.
## Next steps
Walking through a static policy end-to-end.
Adaptive algorithms, contextual bandits, per-entity bandits.
The math behind targets, detectable effects, and runtime estimates.
Diagnostics for running policies: SRM, freshness, guardrails.
The audit trail of every policy lifecycle action.
How concluded decision records roll up into reported impact.