> ## Documentation Index
> Fetch the complete documentation index at: https://docs.traffical.io/llms.txt
> Use this file to discover all available pages before exploring further.
# Metrics in the dashboard
> Define conversion, sum, count, ratio, and composite metrics, certify the ones your team trusts, attach them to policies, and read the results scorecard.
The **Metrics** page is your project's metric catalog: every measurable definition, built once from an event or warehouse fact and reused across every [policy](/dashboard/layers-and-policies) that needs it.
The page has two tabs. **Metrics** is the catalog described here; **Protocols** holds your [measurement protocols](/governance/measurement-protocols) — reusable, certifiable rule sets that decide how [changes](/concepts/changes) get measured.
 ## The metrics list
Each row shows the metric's name (plus its display alias and any **Synced** or **Certified** badge), its source — a Traffical-native event or a warehouse fact, linked to its definition — its type, unit, and desired direction. Click a row to open the [detail page](#the-metric-detail-page).
Filter chips narrow the list by source (**Event** / **Warehouse**), by **Synced** (config-as-code metrics), by **Certified**, or show **Archived** metrics, which are hidden by default. Certified and synced metrics have no edit or delete actions in the list — they're read-only until [uncertified](#certification) or changed in your config file.
On Traffical-native projects, event-based metrics also show a one-click **Migrate to warehouse-native** row action (a banner above the list counts the candidates) — migrating re-links the metric to its matching fact so it's processed on the unified [pipeline](/dashboard/pipeline), without changing what it measures.
## Creating a metric
Click **Create Metric**. The dialog puts configuration on the left and a live preview — including the auto-generated name — on the right.
## The metrics list
Each row shows the metric's name (plus its display alias and any **Synced** or **Certified** badge), its source — a Traffical-native event or a warehouse fact, linked to its definition — its type, unit, and desired direction. Click a row to open the [detail page](#the-metric-detail-page).
Filter chips narrow the list by source (**Event** / **Warehouse**), by **Synced** (config-as-code metrics), by **Certified**, or show **Archived** metrics, which are hidden by default. Certified and synced metrics have no edit or delete actions in the list — they're read-only until [uncertified](#certification) or changed in your config file.
On Traffical-native projects, event-based metrics also show a one-click **Migrate to warehouse-native** row action (a banner above the list counts the candidates) — migrating re-links the metric to its matching fact so it's processed on the unified [pipeline](/dashboard/pipeline), without changing what it measures.
## Creating a metric
Click **Create Metric**. The dialog puts configuration on the left and a live preview — including the auto-generated name — on the right.
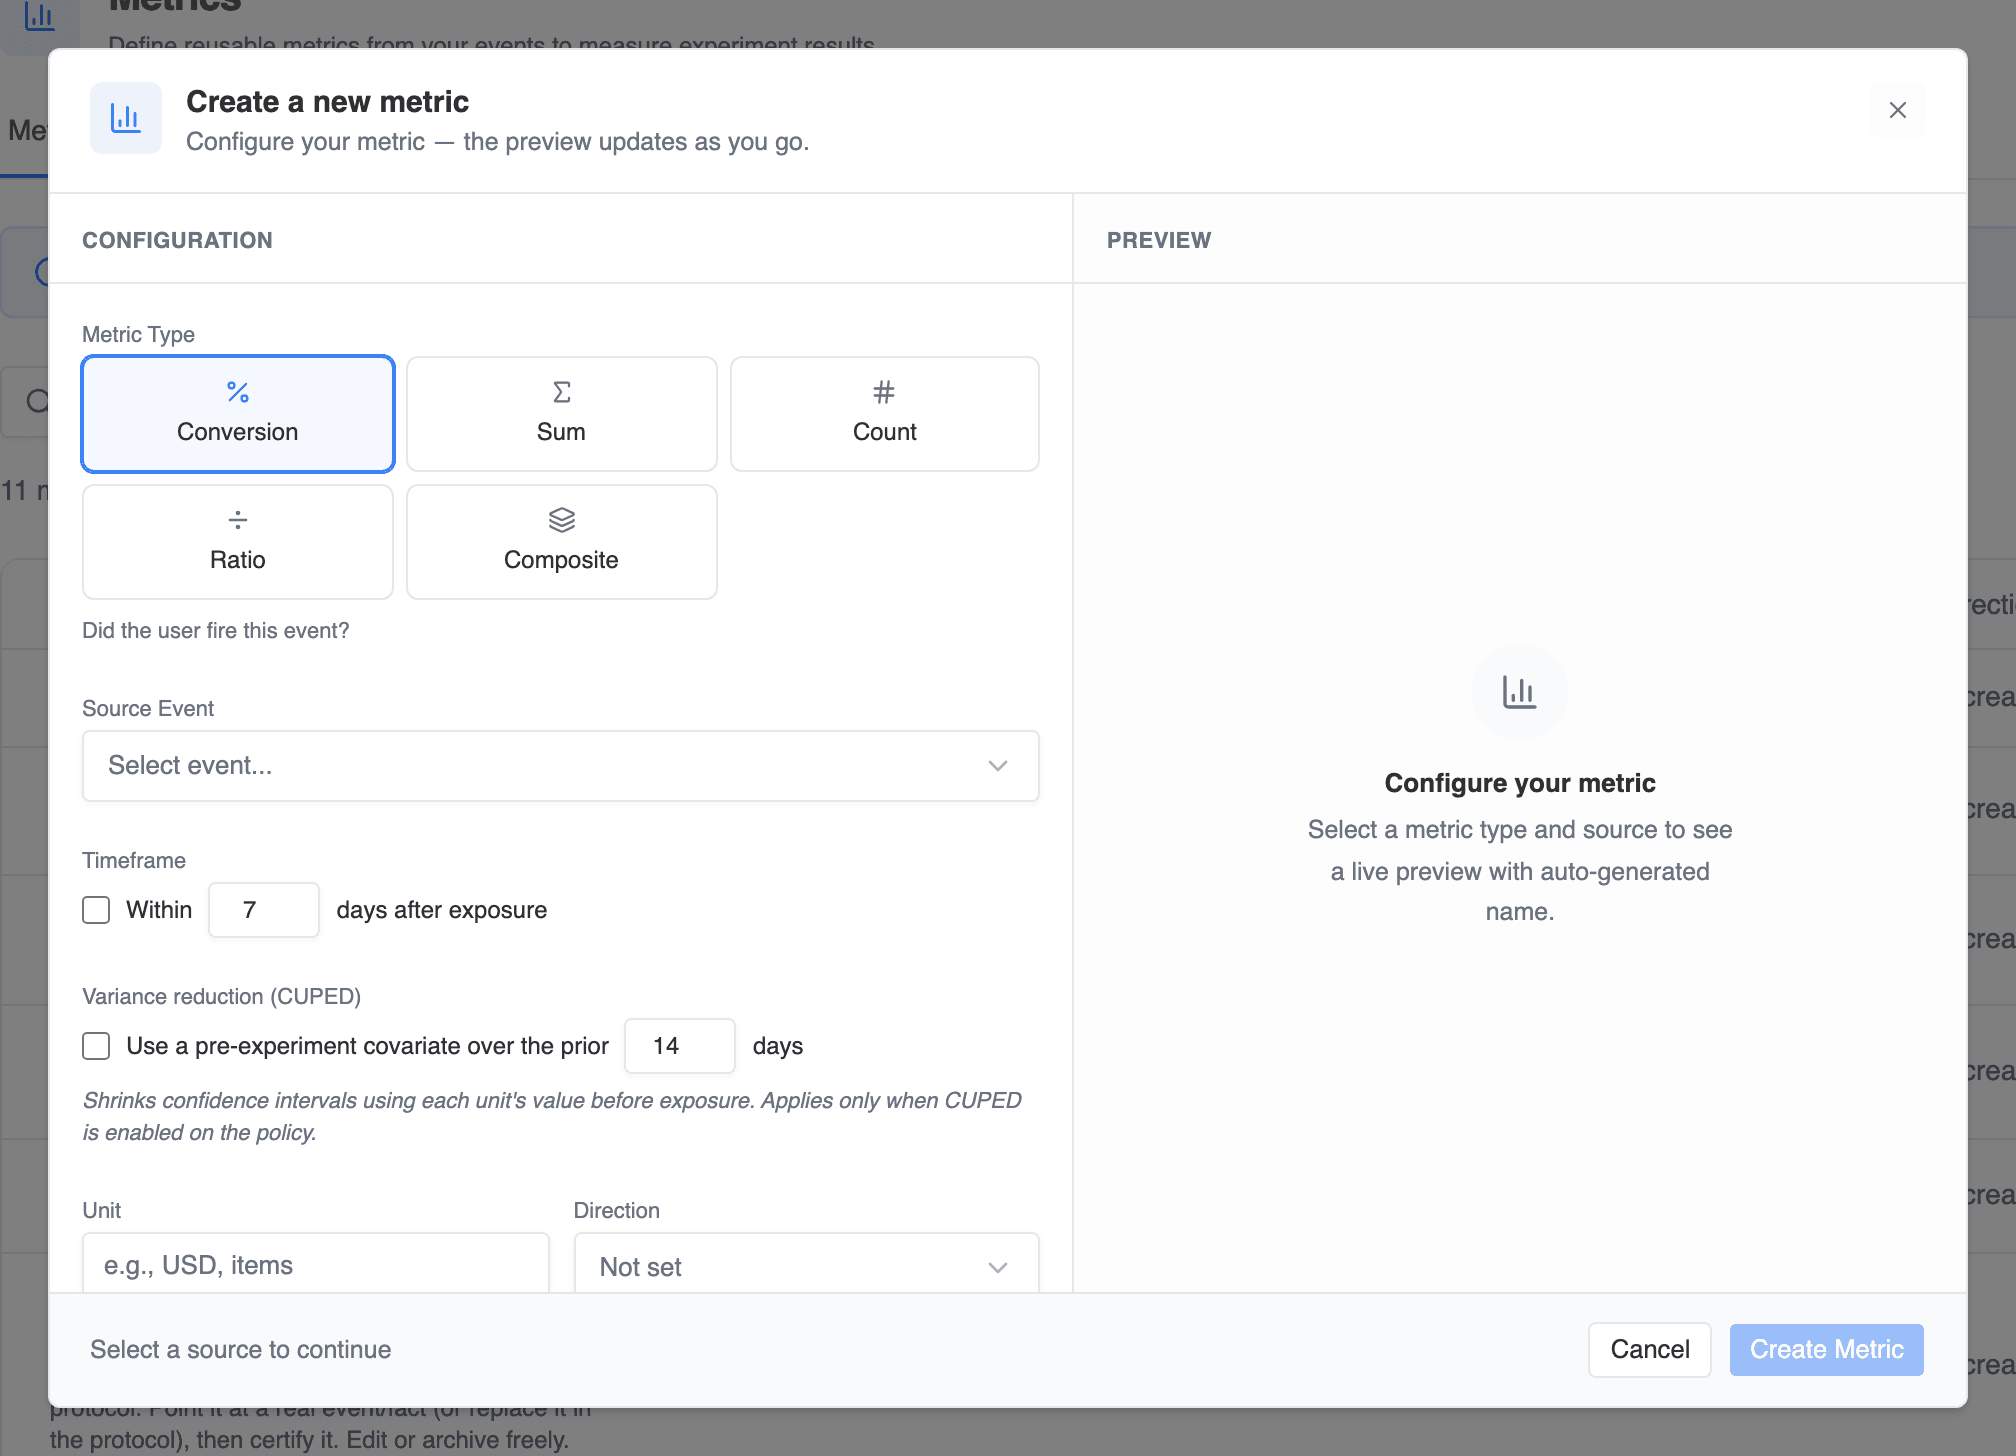 Pick a metric type first:
| Type | What it measures |
| -------------- | ---------------------------------------------------------------------- |
| **Conversion** | Did the unit fire this event? A 0/1 outcome, reported as a proportion. |
| **Sum** | Total value per unit — pick a measure column (e.g. `order_total`). |
| **Count** | Total occurrences per unit. |
| **Ratio** | Numerator ÷ denominator across totals (e.g. revenue per session). |
| **Composite** | Weighted blend of components (e.g. revenue − returns cost). |
Then pick the source. On Traffical-native projects that's an [event](/dashboard/events); on warehouse-connected projects it's a [fact definition](/dashboard/definitions#facts) — SDK-tracked events appear in the fact list with an **SDK Event** badge. For **Sum**, also choose the measure to total; event-sourced metrics default to the event's value.
### Ratio metrics
A ratio compares two facts, so both sides come from the warehouse. The fact and measure you picked above are the **numerator**; the **Denominator** panel takes a second fact and measure. The auto-generated name spells out both sides — `purchase.revenue per click.sessions [ratio]` reads as "revenue per session." Standard errors use the delta method — see [Ratio metrics](/statistics/ratio-metrics).
### Composite metrics
A composite is a weighted sum of components — the way to express a net objective like *revenue minus returns cost*. Instead of a single source, you build a list of component rows:
Pick a metric type first:
| Type | What it measures |
| -------------- | ---------------------------------------------------------------------- |
| **Conversion** | Did the unit fire this event? A 0/1 outcome, reported as a proportion. |
| **Sum** | Total value per unit — pick a measure column (e.g. `order_total`). |
| **Count** | Total occurrences per unit. |
| **Ratio** | Numerator ÷ denominator across totals (e.g. revenue per session). |
| **Composite** | Weighted blend of components (e.g. revenue − returns cost). |
Then pick the source. On Traffical-native projects that's an [event](/dashboard/events); on warehouse-connected projects it's a [fact definition](/dashboard/definitions#facts) — SDK-tracked events appear in the fact list with an **SDK Event** badge. For **Sum**, also choose the measure to total; event-sourced metrics default to the event's value.
### Ratio metrics
A ratio compares two facts, so both sides come from the warehouse. The fact and measure you picked above are the **numerator**; the **Denominator** panel takes a second fact and measure. The auto-generated name spells out both sides — `purchase.revenue per click.sessions [ratio]` reads as "revenue per session." Standard errors use the delta method — see [Ratio metrics](/statistics/ratio-metrics).
### Composite metrics
A composite is a weighted sum of components — the way to express a net objective like *revenue minus returns cost*. Instead of a single source, you build a list of component rows:
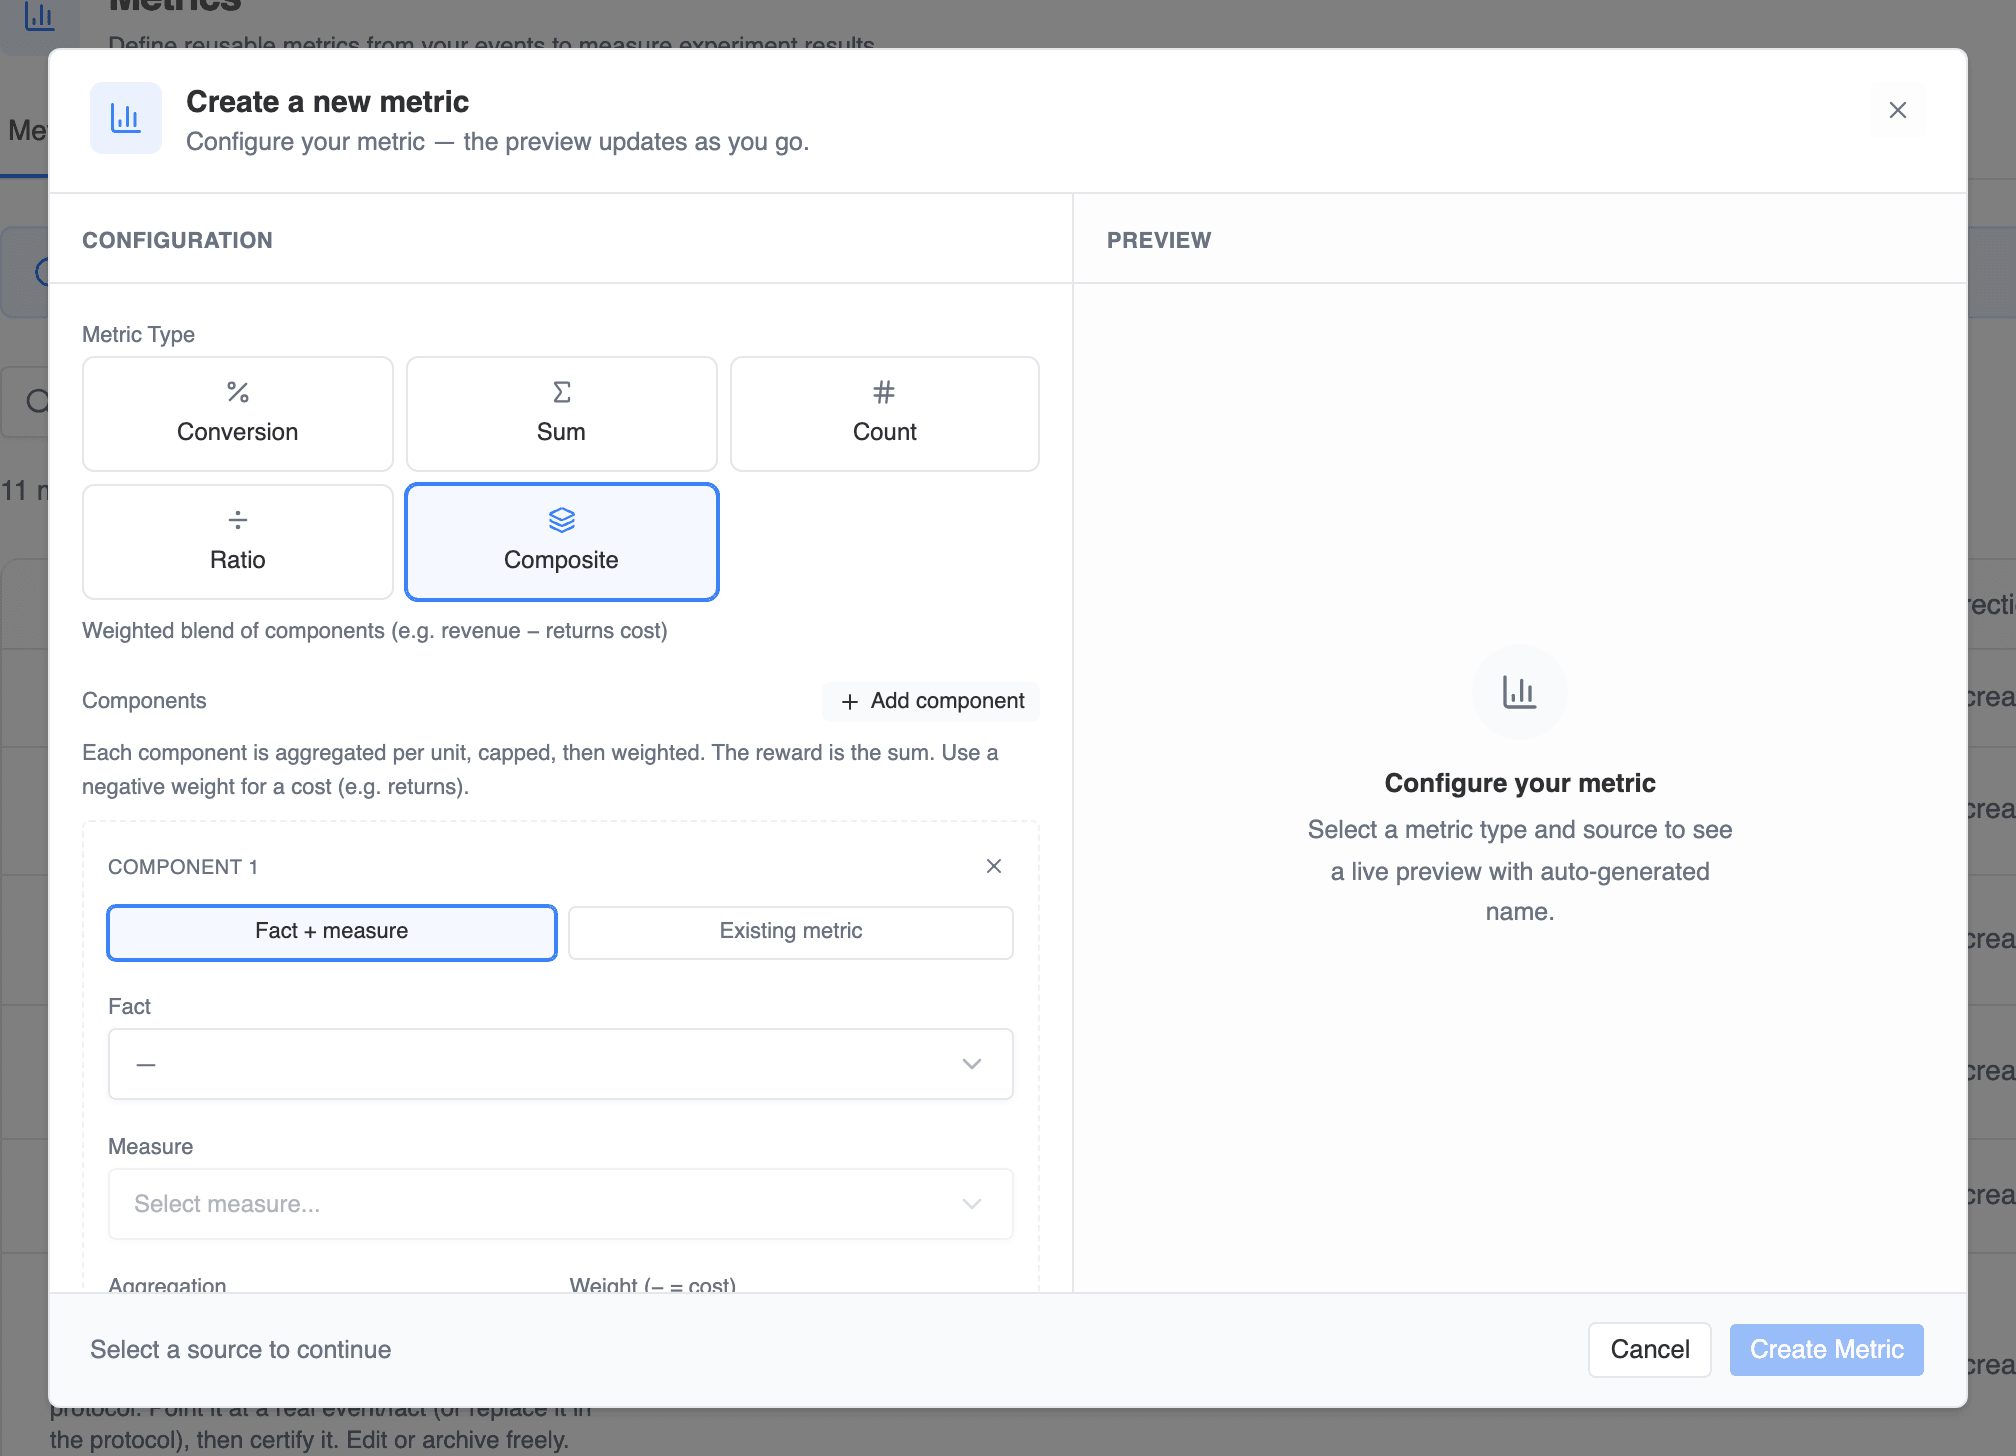 Each component is either a **fact + measure** or an **existing metric** (fact-backed conversion, count, or sum metrics only — no ratios, and composites can't nest). Per component you set:
* **Aggregation** — binary (fired ≥ 1 → 0/1), count, or sum of a measure.
* **Weight** — a negative weight subtracts; that's how a cost component works.
* **Cap** (optional) — clamps each unit's value before weighting, so one whale can't dominate the reward.
* **Window** (optional) — a per-component attribution window, counting only value from *X* to *Y* days after exposure.
Per unit, the metric is the sum of the weighted, capped components. It behaves as a per-unit average everywhere downstream — significance, confidence intervals, and [adaptive optimization](/experimentation/optimization) — which is what makes a composite a good goal metric: the optimizer maximizes the net objective directly instead of you hand-tuning one event.
### Names
Metric names follow a convention — `orders.order_total [sum]`, `purchase per click [ratio]` — and are generated as you configure, locked by default. Click **Edit** next to the name to customize it, **Reset** to return to the convention. Duplicates get a `#2` suffix; filters add a qualifier like `checkout/country=de`. An optional display alias shows a friendlier label in the UI without changing the name.
### Filters, timeframe, and direction
* **Filters** restrict which events count (e.g. only `status = completed`). Available columns come from properties marked as dimensions on the [event's property schema](/dashboard/events#properties), or from the fact's dimension columns. Operators: equals, not equals, in, not in.
* **Timeframe** limits attribution to the first *N* days after exposure.
* **Unit** is a display label (`USD`, `items`).
* **Direction** declares whether the metric should **increase** or **decrease** — it colors results and sets the default guardrail direction when the metric is attached as one. Warehouse measures can carry a preferred direction, which pre-fills this field.
* **Default MDE (%)** is the smallest change worth acting on — the default [measurement-progress](/statistics/measurement-progress) target wherever this metric is attached.
### Variance reduction (CUPED)
On **Conversion** and **Sum** metrics you can enable a pre-experiment covariate: the metric's own value over a lookback window (default 14 days) before each unit's exposure. It shrinks confidence intervals and takes effect only when [CUPED](/statistics/cuped) is also enabled on the policy or project. CUPED isn't available for count or ratio metrics.
## Certification
Certifying a metric marks it as a trusted, validated definition — the standard your team measures with. Click **Certify** on the metric's detail page. A certified metric:
* becomes **read-only**, so the definition can't drift under running experiments, and
* is eligible for [measurement protocols](/governance/measurement-protocols) — protocols pick from certified metrics only, and a protocol can itself only be certified when every metric it references is certified. That certified coverage is what lets low-risk changes [auto-approve their measurement plans](/governance/approvals-and-autonomy).
Uncertifying is deliberate: it asks you to type `UNCERTIFY`, since colleagues and running experiments may rely on the definition. Once uncertified, the metric becomes editable again.
Metric definitions can also live as config-as-code in a metrics file pushed via the [CLI](/tools/cli) — see the [config file reference](/tools/config-file). Synced metrics show a **Synced** badge, are read-only in the dashboard, and change (including their `certified` flag) only through your file and the next push.
## Attaching metrics to policies
On a policy's detail page, open the metrics panel and click **Attach Metrics**. The dialog is a catalog and a cart: browse and multi-select on the left (search with ⌘K, filter by type, hide already-attached), and manage the attached set on the right, grouped by role.
Each component is either a **fact + measure** or an **existing metric** (fact-backed conversion, count, or sum metrics only — no ratios, and composites can't nest). Per component you set:
* **Aggregation** — binary (fired ≥ 1 → 0/1), count, or sum of a measure.
* **Weight** — a negative weight subtracts; that's how a cost component works.
* **Cap** (optional) — clamps each unit's value before weighting, so one whale can't dominate the reward.
* **Window** (optional) — a per-component attribution window, counting only value from *X* to *Y* days after exposure.
Per unit, the metric is the sum of the weighted, capped components. It behaves as a per-unit average everywhere downstream — significance, confidence intervals, and [adaptive optimization](/experimentation/optimization) — which is what makes a composite a good goal metric: the optimizer maximizes the net objective directly instead of you hand-tuning one event.
### Names
Metric names follow a convention — `orders.order_total [sum]`, `purchase per click [ratio]` — and are generated as you configure, locked by default. Click **Edit** next to the name to customize it, **Reset** to return to the convention. Duplicates get a `#2` suffix; filters add a qualifier like `checkout/country=de`. An optional display alias shows a friendlier label in the UI without changing the name.
### Filters, timeframe, and direction
* **Filters** restrict which events count (e.g. only `status = completed`). Available columns come from properties marked as dimensions on the [event's property schema](/dashboard/events#properties), or from the fact's dimension columns. Operators: equals, not equals, in, not in.
* **Timeframe** limits attribution to the first *N* days after exposure.
* **Unit** is a display label (`USD`, `items`).
* **Direction** declares whether the metric should **increase** or **decrease** — it colors results and sets the default guardrail direction when the metric is attached as one. Warehouse measures can carry a preferred direction, which pre-fills this field.
* **Default MDE (%)** is the smallest change worth acting on — the default [measurement-progress](/statistics/measurement-progress) target wherever this metric is attached.
### Variance reduction (CUPED)
On **Conversion** and **Sum** metrics you can enable a pre-experiment covariate: the metric's own value over a lookback window (default 14 days) before each unit's exposure. It shrinks confidence intervals and takes effect only when [CUPED](/statistics/cuped) is also enabled on the policy or project. CUPED isn't available for count or ratio metrics.
## Certification
Certifying a metric marks it as a trusted, validated definition — the standard your team measures with. Click **Certify** on the metric's detail page. A certified metric:
* becomes **read-only**, so the definition can't drift under running experiments, and
* is eligible for [measurement protocols](/governance/measurement-protocols) — protocols pick from certified metrics only, and a protocol can itself only be certified when every metric it references is certified. That certified coverage is what lets low-risk changes [auto-approve their measurement plans](/governance/approvals-and-autonomy).
Uncertifying is deliberate: it asks you to type `UNCERTIFY`, since colleagues and running experiments may rely on the definition. Once uncertified, the metric becomes editable again.
Metric definitions can also live as config-as-code in a metrics file pushed via the [CLI](/tools/cli) — see the [config file reference](/tools/config-file). Synced metrics show a **Synced** badge, are read-only in the dashboard, and change (including their `certified` flag) only through your file and the next push.
## Attaching metrics to policies
On a policy's detail page, open the metrics panel and click **Attach Metrics**. The dialog is a catalog and a cart: browse and multi-select on the left (search with ⌘K, filter by type, hide already-attached), and manage the attached set on the right, grouped by role.
 * **Primary** — exactly one, required whenever metrics are attached. It drives the decision. Promoting another metric demotes the current primary to secondary.
* **Secondary** — any number, tracked alongside without driving decisions.
* **Guardrail** — any number. Each needs a threshold (**above** or **below** a value, defaulted from the metric's desired direction); a breach blocks the rollout.
Primary and secondary attachments can carry a per-policy **target MDE** override; left empty, they inherit the metric's default. Guardrails don't take one — their threshold is the target.
## Reading the results scorecard
The policy's scorecard lists every attached metric grouped by role, with per-allocation lift, confidence interval, and a significance verdict; guardrails additionally show a status chip against their threshold.
* **Primary** — exactly one, required whenever metrics are attached. It drives the decision. Promoting another metric demotes the current primary to secondary.
* **Secondary** — any number, tracked alongside without driving decisions.
* **Guardrail** — any number. Each needs a threshold (**above** or **below** a value, defaulted from the metric's desired direction); a breach blocks the rollout.
Primary and secondary attachments can carry a per-policy **target MDE** override; left empty, they inherit the metric's default. Guardrails don't take one — their threshold is the target.
## Reading the results scorecard
The policy's scorecard lists every attached metric grouped by role, with per-allocation lift, confidence interval, and a significance verdict; guardrails additionally show a status chip against their threshold.
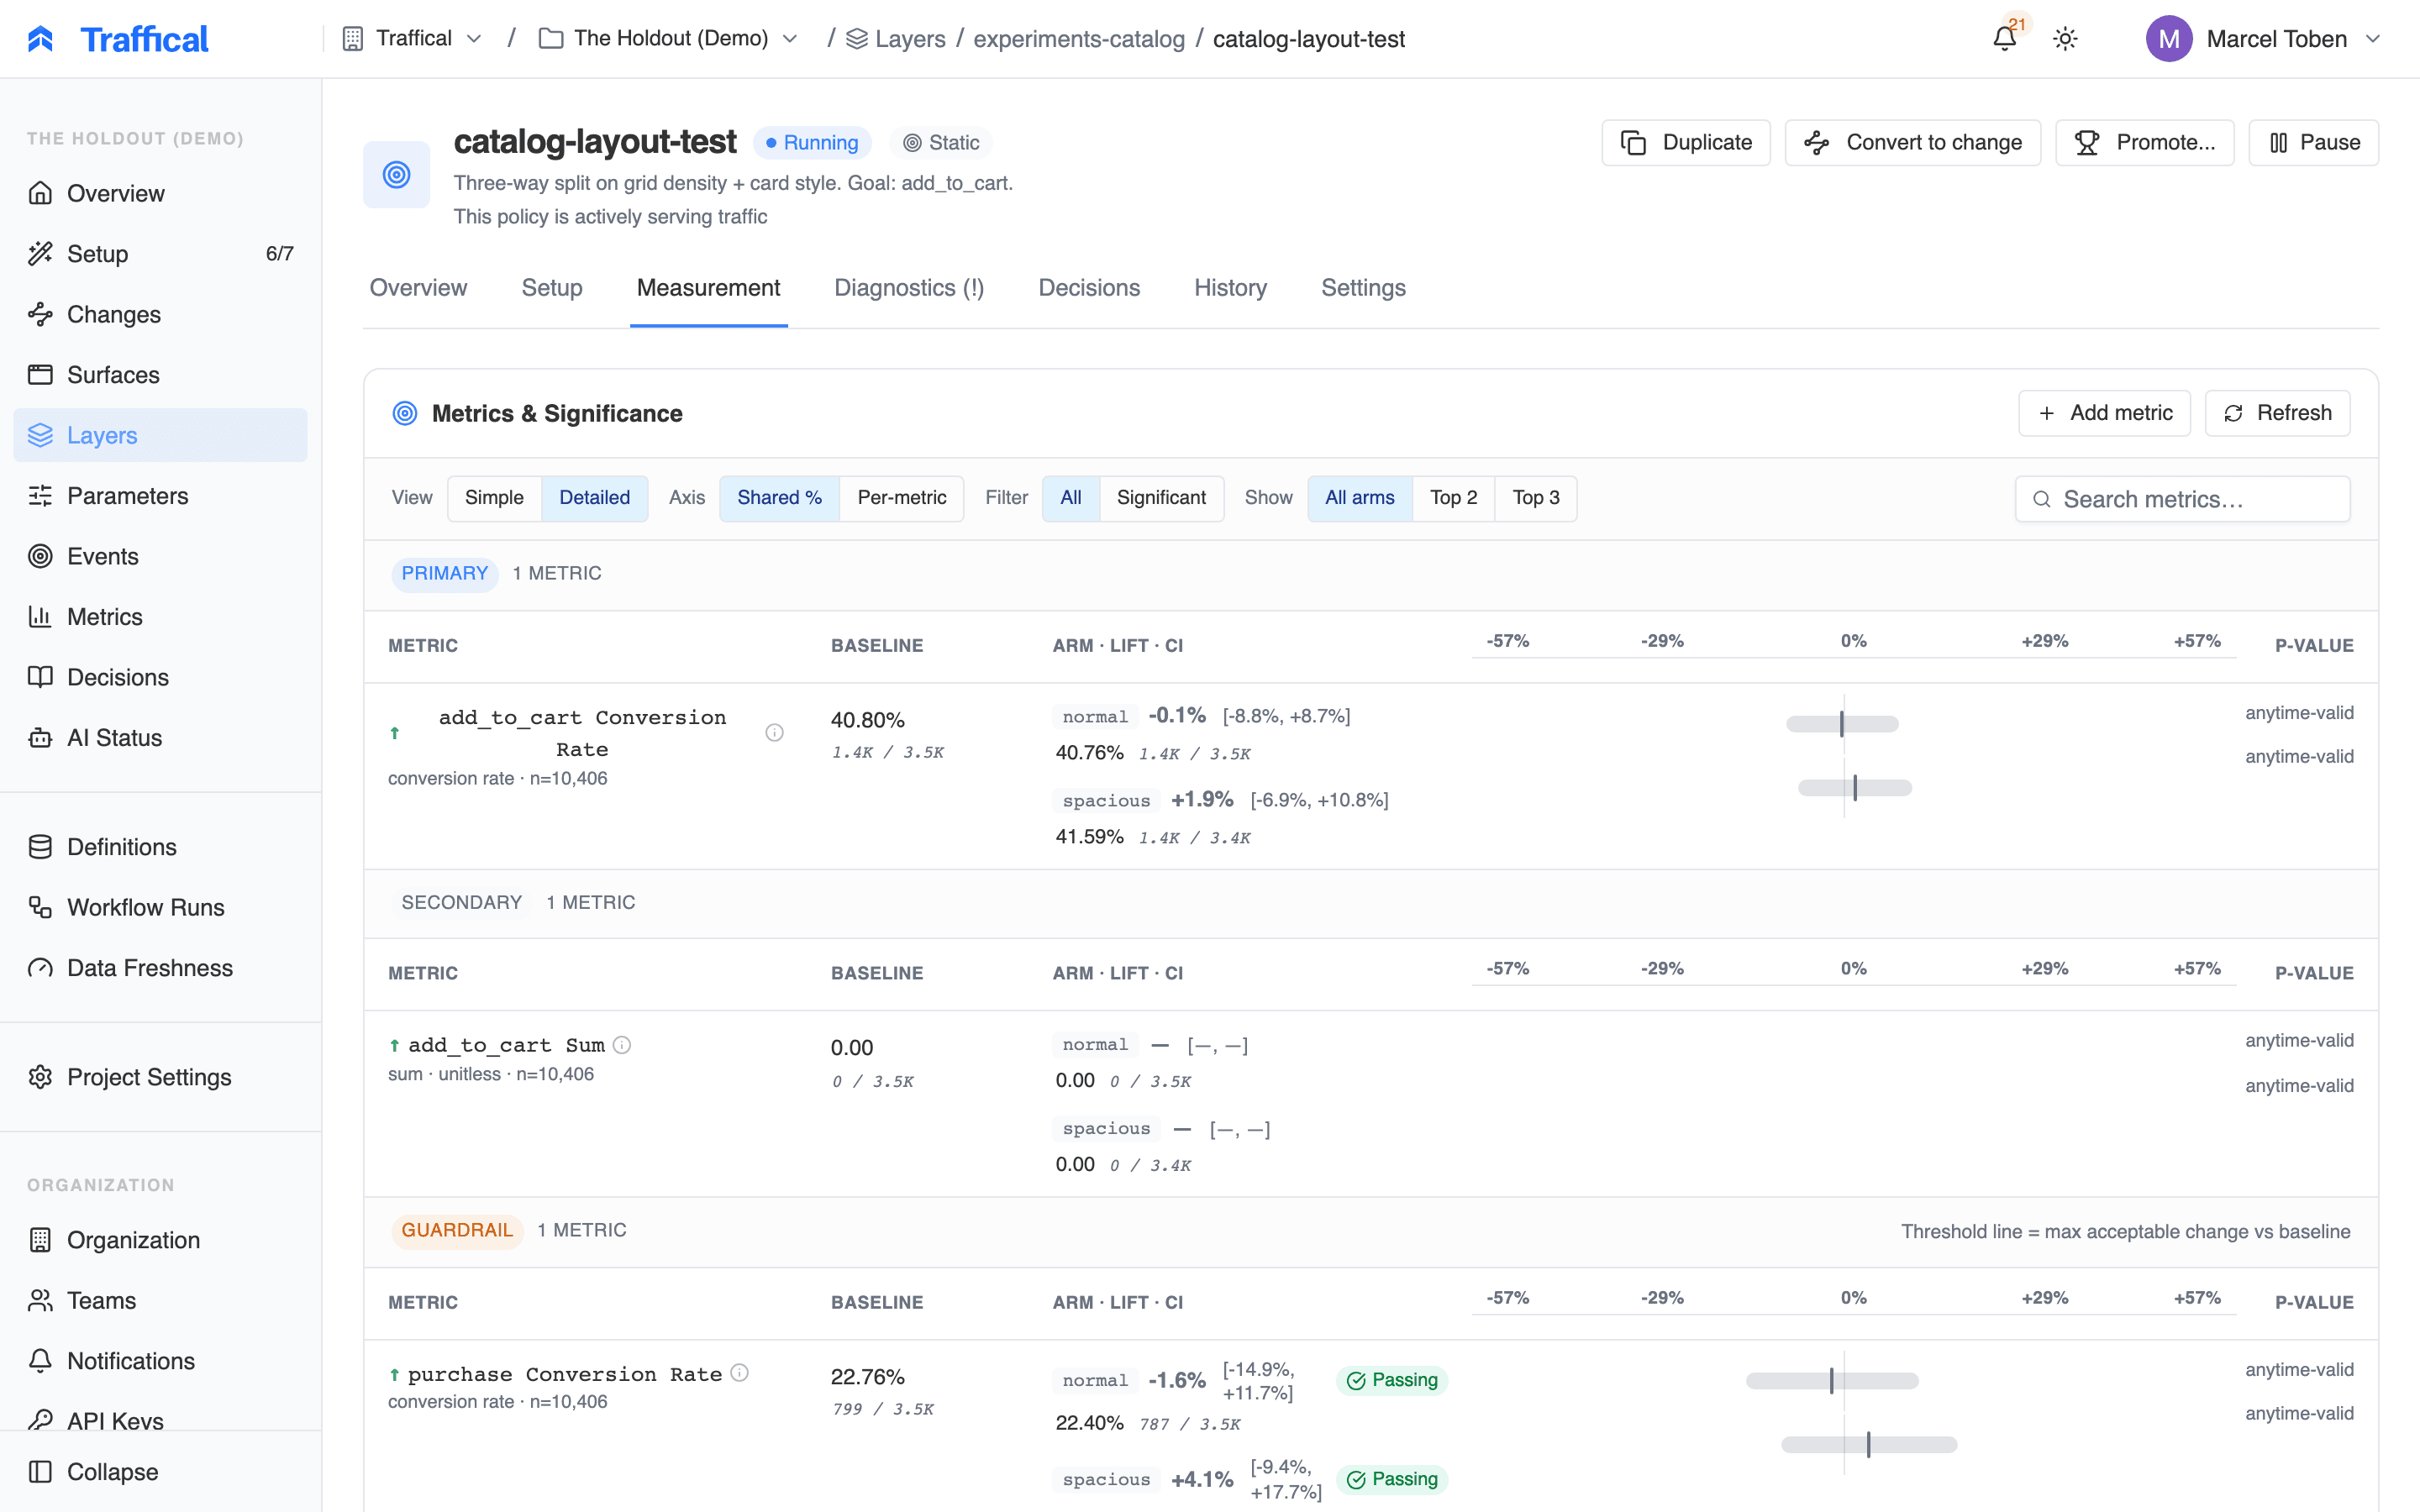 Right after attaching, the scorecard is in a **pending** state: a banner confirms the metrics are attached and ready, and each cell reads "awaiting data" until the first measurement computes. Significance, lift, and confidence intervals fill in from the first refresh onward. For how the numbers are computed — including anytime-valid [sequential testing](/statistics/sequential-testing) and time-to-significance estimates on the [measurement progress](/statistics/measurement-progress) card — see the [Statistics](/statistics/overview) section.
## The metric detail page
Right after attaching, the scorecard is in a **pending** state: a banner confirms the metrics are attached and ready, and each cell reads "awaiting data" until the first measurement computes. Significance, lift, and confidence intervals fill in from the first refresh onward. For how the numbers are computed — including anytime-valid [sequential testing](/statistics/sequential-testing) and time-to-significance estimates on the [measurement progress](/statistics/measurement-progress) card — see the [Statistics](/statistics/overview) section.
## The metric detail page
 The detail page shows the metric's volume over time with a date-range picker (last 30 days by default), and every policy using the metric with its role in each. For conversion metrics the chart shows raw conversions — a *rate* needs an exposed population, so rates live on the per-policy scorecard.
The **Definition** rail summarizes the source (linked to its event or fact), unit, default MDE, measure column, timeframe, and filters, alongside a metadata card with IDs and timestamps.
### Editing, archiving, and deleting
A metric is editable while it's neither certified, synced, nor archived — **Uncertify** makes a certified metric editable again. Two ways to retire one:
* **Archive** hides the metric from the catalog and blocks new attachments while preserving every past policy reference. Archiving is refused while a running or paused policy still uses the metric; unarchive restores it any time.
* **Delete** is only allowed if the metric has never shipped in a non-draft policy. Once it has, the definition is part of the evidence record for those experiments — the server refuses and points you to archive instead.
## Next steps
Turn certified metrics into reusable measurement rules for changes.
Where warehouse-native fact definitions live.
Picking a primary metric and guardrails.
Significance, sequential testing, CUPED, and ratio metrics.
The detail page shows the metric's volume over time with a date-range picker (last 30 days by default), and every policy using the metric with its role in each. For conversion metrics the chart shows raw conversions — a *rate* needs an exposed population, so rates live on the per-policy scorecard.
The **Definition** rail summarizes the source (linked to its event or fact), unit, default MDE, measure column, timeframe, and filters, alongside a metadata card with IDs and timestamps.
### Editing, archiving, and deleting
A metric is editable while it's neither certified, synced, nor archived — **Uncertify** makes a certified metric editable again. Two ways to retire one:
* **Archive** hides the metric from the catalog and blocks new attachments while preserving every past policy reference. Archiving is refused while a running or paused policy still uses the metric; unarchive restores it any time.
* **Delete** is only allowed if the metric has never shipped in a non-draft policy. Once it has, the definition is part of the evidence record for those experiments — the server refuses and points you to archive instead.
## Next steps
Turn certified metrics into reusable measurement rules for changes.
Where warehouse-native fact definitions live.
Picking a primary metric and guardrails.
Significance, sequential testing, CUPED, and ratio metrics.