> ## Documentation Index
> Fetch the complete documentation index at: https://docs.traffical.io/llms.txt
> Use this file to discover all available pages before exploring further.
# Dashboard tour
> A guided walkthrough of the Traffical dashboard — where to find what, and what each section is for.
The dashboard lives at [app.traffical.io](https://app.traffical.io). It's where you create projects, define parameters, run experiments, watch metrics, and manage everything that doesn't fit in code.
This is a tour. Each section links to a deeper walkthrough.
## The hierarchy
The URL structure mirrors the [hierarchy](/concepts/projects-and-environments): organization → project → resource.
```
app.traffical.io/{orgKey} ← org-level: teams, notifications, API keys, billing
app.traffical.io/{orgKey}/{projectKey} ← the project overview: KPIs + impact
app.traffical.io/{orgKey}/{projectKey}/changes
app.traffical.io/{orgKey}/{projectKey}/surfaces
app.traffical.io/{orgKey}/{projectKey}/layers
app.traffical.io/{orgKey}/{projectKey}/parameters
app.traffical.io/{orgKey}/{projectKey}/events
app.traffical.io/{orgKey}/{projectKey}/metrics
app.traffical.io/{orgKey}/{projectKey}/decisions
app.traffical.io/{orgKey}/{projectKey}/ai
app.traffical.io/{orgKey}/{projectKey}/definitions
app.traffical.io/{orgKey}/{projectKey}/workflow-runs
app.traffical.io/{orgKey}/{projectKey}/data-freshness
app.traffical.io/{orgKey}/{projectKey}/settings
```
The sidebar follows the same structure, in four groups: the project pages (under the project's name), the pipeline pages, project settings, and the organization pages.
 ## What's where
Some sidebar items appear only when you hold the matching [permission](/governance/roles-and-permissions) or when the feature is enabled for your organization — if you don't see **Changes** or **Billing**, that's why.
### Project
The project's landing page — KPIs, aggregated impact, traffic, recent activity. Toured below.
Step-by-step wizard for wiring up a new project — warehouse, SDK, first parameters — with progress tracked in the sidebar.
Governed change lifecycle — wizard, approvals, transitions. Enabled per organization; if you don't see **Changes** in the sidebar it isn't enabled for you yet.
The product contexts changes land in — where risk is classified and [measurement protocols](/governance/measurement-protocols) attach.
Traffic containers and the policies inside them. The bulk of day-to-day experiment work.
All parameters in the project — synced (from CLI) and dashboard-only.
Event definitions, property schemas, the event explorer.
Metric definitions and their results.
Audit log of every policy lifecycle change.
Every adaptive policy, grouped by convergence state. Toured below.
### Pipeline
Entities, assignments, facts — for warehouse-native metrics.
Every pipeline run — status, timing, per-run detail.
How current the computed warehouse data is, per definition.
### Settings
The settings group holds [project settings](/dashboard/settings): warehouse connection, SDK sync, hashing config, pipeline scheduling, maintenance.
### Organization
Members, roles, and team ownership of parameter groups.
Choose which alerts you get and where they're delivered.
Create and revoke `traffical_sk_...` keys (SDK or management scope) per project + environment.
Plan, usage, invoices.
## The project overview
The project's landing page answers "how is this project doing right now":
* **KPI cards** — active layers broken down by policy state, plus exposures, unique users, and reward rate over the last 24 hours, each with a trend sparkline.
* **Impact** — what your concluded changes are worth ([below](#impact)).
* **Traffic Overview** — decisions, exposures, tracks, and rewards per day, alongside a view of layer bucket allocation.
* **Recent activity** — the latest project events, so you catch what teammates (and the optimizer) did.
Data refreshes automatically about every five minutes; the header shows the timestamp of the data you're looking at.
### Impact
The **Impact** section aggregates concluded [changes](/concepts/changes) and standalone policies into one program-level answer: what has shipped, and what is it worth per day?
## What's where
Some sidebar items appear only when you hold the matching [permission](/governance/roles-and-permissions) or when the feature is enabled for your organization — if you don't see **Changes** or **Billing**, that's why.
### Project
The project's landing page — KPIs, aggregated impact, traffic, recent activity. Toured below.
Step-by-step wizard for wiring up a new project — warehouse, SDK, first parameters — with progress tracked in the sidebar.
Governed change lifecycle — wizard, approvals, transitions. Enabled per organization; if you don't see **Changes** in the sidebar it isn't enabled for you yet.
The product contexts changes land in — where risk is classified and [measurement protocols](/governance/measurement-protocols) attach.
Traffic containers and the policies inside them. The bulk of day-to-day experiment work.
All parameters in the project — synced (from CLI) and dashboard-only.
Event definitions, property schemas, the event explorer.
Metric definitions and their results.
Audit log of every policy lifecycle change.
Every adaptive policy, grouped by convergence state. Toured below.
### Pipeline
Entities, assignments, facts — for warehouse-native metrics.
Every pipeline run — status, timing, per-run detail.
How current the computed warehouse data is, per definition.
### Settings
The settings group holds [project settings](/dashboard/settings): warehouse connection, SDK sync, hashing config, pipeline scheduling, maintenance.
### Organization
Members, roles, and team ownership of parameter groups.
Choose which alerts you get and where they're delivered.
Create and revoke `traffical_sk_...` keys (SDK or management scope) per project + environment.
Plan, usage, invoices.
## The project overview
The project's landing page answers "how is this project doing right now":
* **KPI cards** — active layers broken down by policy state, plus exposures, unique users, and reward rate over the last 24 hours, each with a trend sparkline.
* **Impact** — what your concluded changes are worth ([below](#impact)).
* **Traffic Overview** — decisions, exposures, tracks, and rewards per day, alongside a view of layer bucket allocation.
* **Recent activity** — the latest project events, so you catch what teammates (and the optimizer) did.
Data refreshes automatically about every five minutes; the header shows the timestamp of the data you're looking at.
### Impact
The **Impact** section aggregates concluded [changes](/concepts/changes) and standalone policies into one program-level answer: what has shipped, and what is it worth per day?
 * **Program strip** — shipped winners (with inconclusive conclusions counted alongside as learning), win rate, reverted changes (counted as avoided harm, never as impact), and velocity versus the previous window of the same length.
* **Per-metric table** — one row per affected metric: daily impact with a confidence interval, the window total (a change shipped mid-window accrues only for its live days), footprint, and a cumulative-impact sparkline. Expand a row to see each contributing change.
* **Filters** — narrow to a single [surface](/concepts/surfaces), restrict to results where the metric was the change's **primary** metric, and pick any window with the date-range picker (default: the last 90 days).
* **In flight (unshipped)** — current readings of still-running changes, shown separately and never summed into the totals. A live lift isn't a realized win until the change ships.
* **Optimization (adaptive policies)** — the estimated value of adaptive traffic allocation, versus a uniform split (and versus control where that comparison is causal). Also display-only, never summed into the totals.
Impact figures are **estimates, not measurements**. Each shipped win's ship-time result is projected to full rollout, then discounted by its false-positive risk using the program's observed win rate; group totals assume independence between changes, and interactions between overlapping changes and novelty decay are not modeled. The always-visible note under the table restates this, and its popover carries the exact formulas — see [Impact methodology](/statistics/impact-methodology) for the full math.
## The AI optimization page
The **AI Status** entry in the sidebar opens the **AI Optimization** page: every [adaptive policy](/experimentation/optimization) in the project on one screen, grouped by where it is in its learning lifecycle.
* **Program strip** — shipped winners (with inconclusive conclusions counted alongside as learning), win rate, reverted changes (counted as avoided harm, never as impact), and velocity versus the previous window of the same length.
* **Per-metric table** — one row per affected metric: daily impact with a confidence interval, the window total (a change shipped mid-window accrues only for its live days), footprint, and a cumulative-impact sparkline. Expand a row to see each contributing change.
* **Filters** — narrow to a single [surface](/concepts/surfaces), restrict to results where the metric was the change's **primary** metric, and pick any window with the date-range picker (default: the last 90 days).
* **In flight (unshipped)** — current readings of still-running changes, shown separately and never summed into the totals. A live lift isn't a realized win until the change ships.
* **Optimization (adaptive policies)** — the estimated value of adaptive traffic allocation, versus a uniform split (and versus control where that comparison is causal). Also display-only, never summed into the totals.
Impact figures are **estimates, not measurements**. Each shipped win's ship-time result is projected to full rollout, then discounted by its false-positive risk using the program's observed win rate; group totals assume independence between changes, and interactions between overlapping changes and novelty decay are not modeled. The always-visible note under the table restates this, and its popover carries the exact formulas — see [Impact methodology](/statistics/impact-methodology) for the full math.
## The AI optimization page
The **AI Status** entry in the sidebar opens the **AI Optimization** page: every [adaptive policy](/experimentation/optimization) in the project on one screen, grouped by where it is in its learning lifecycle.
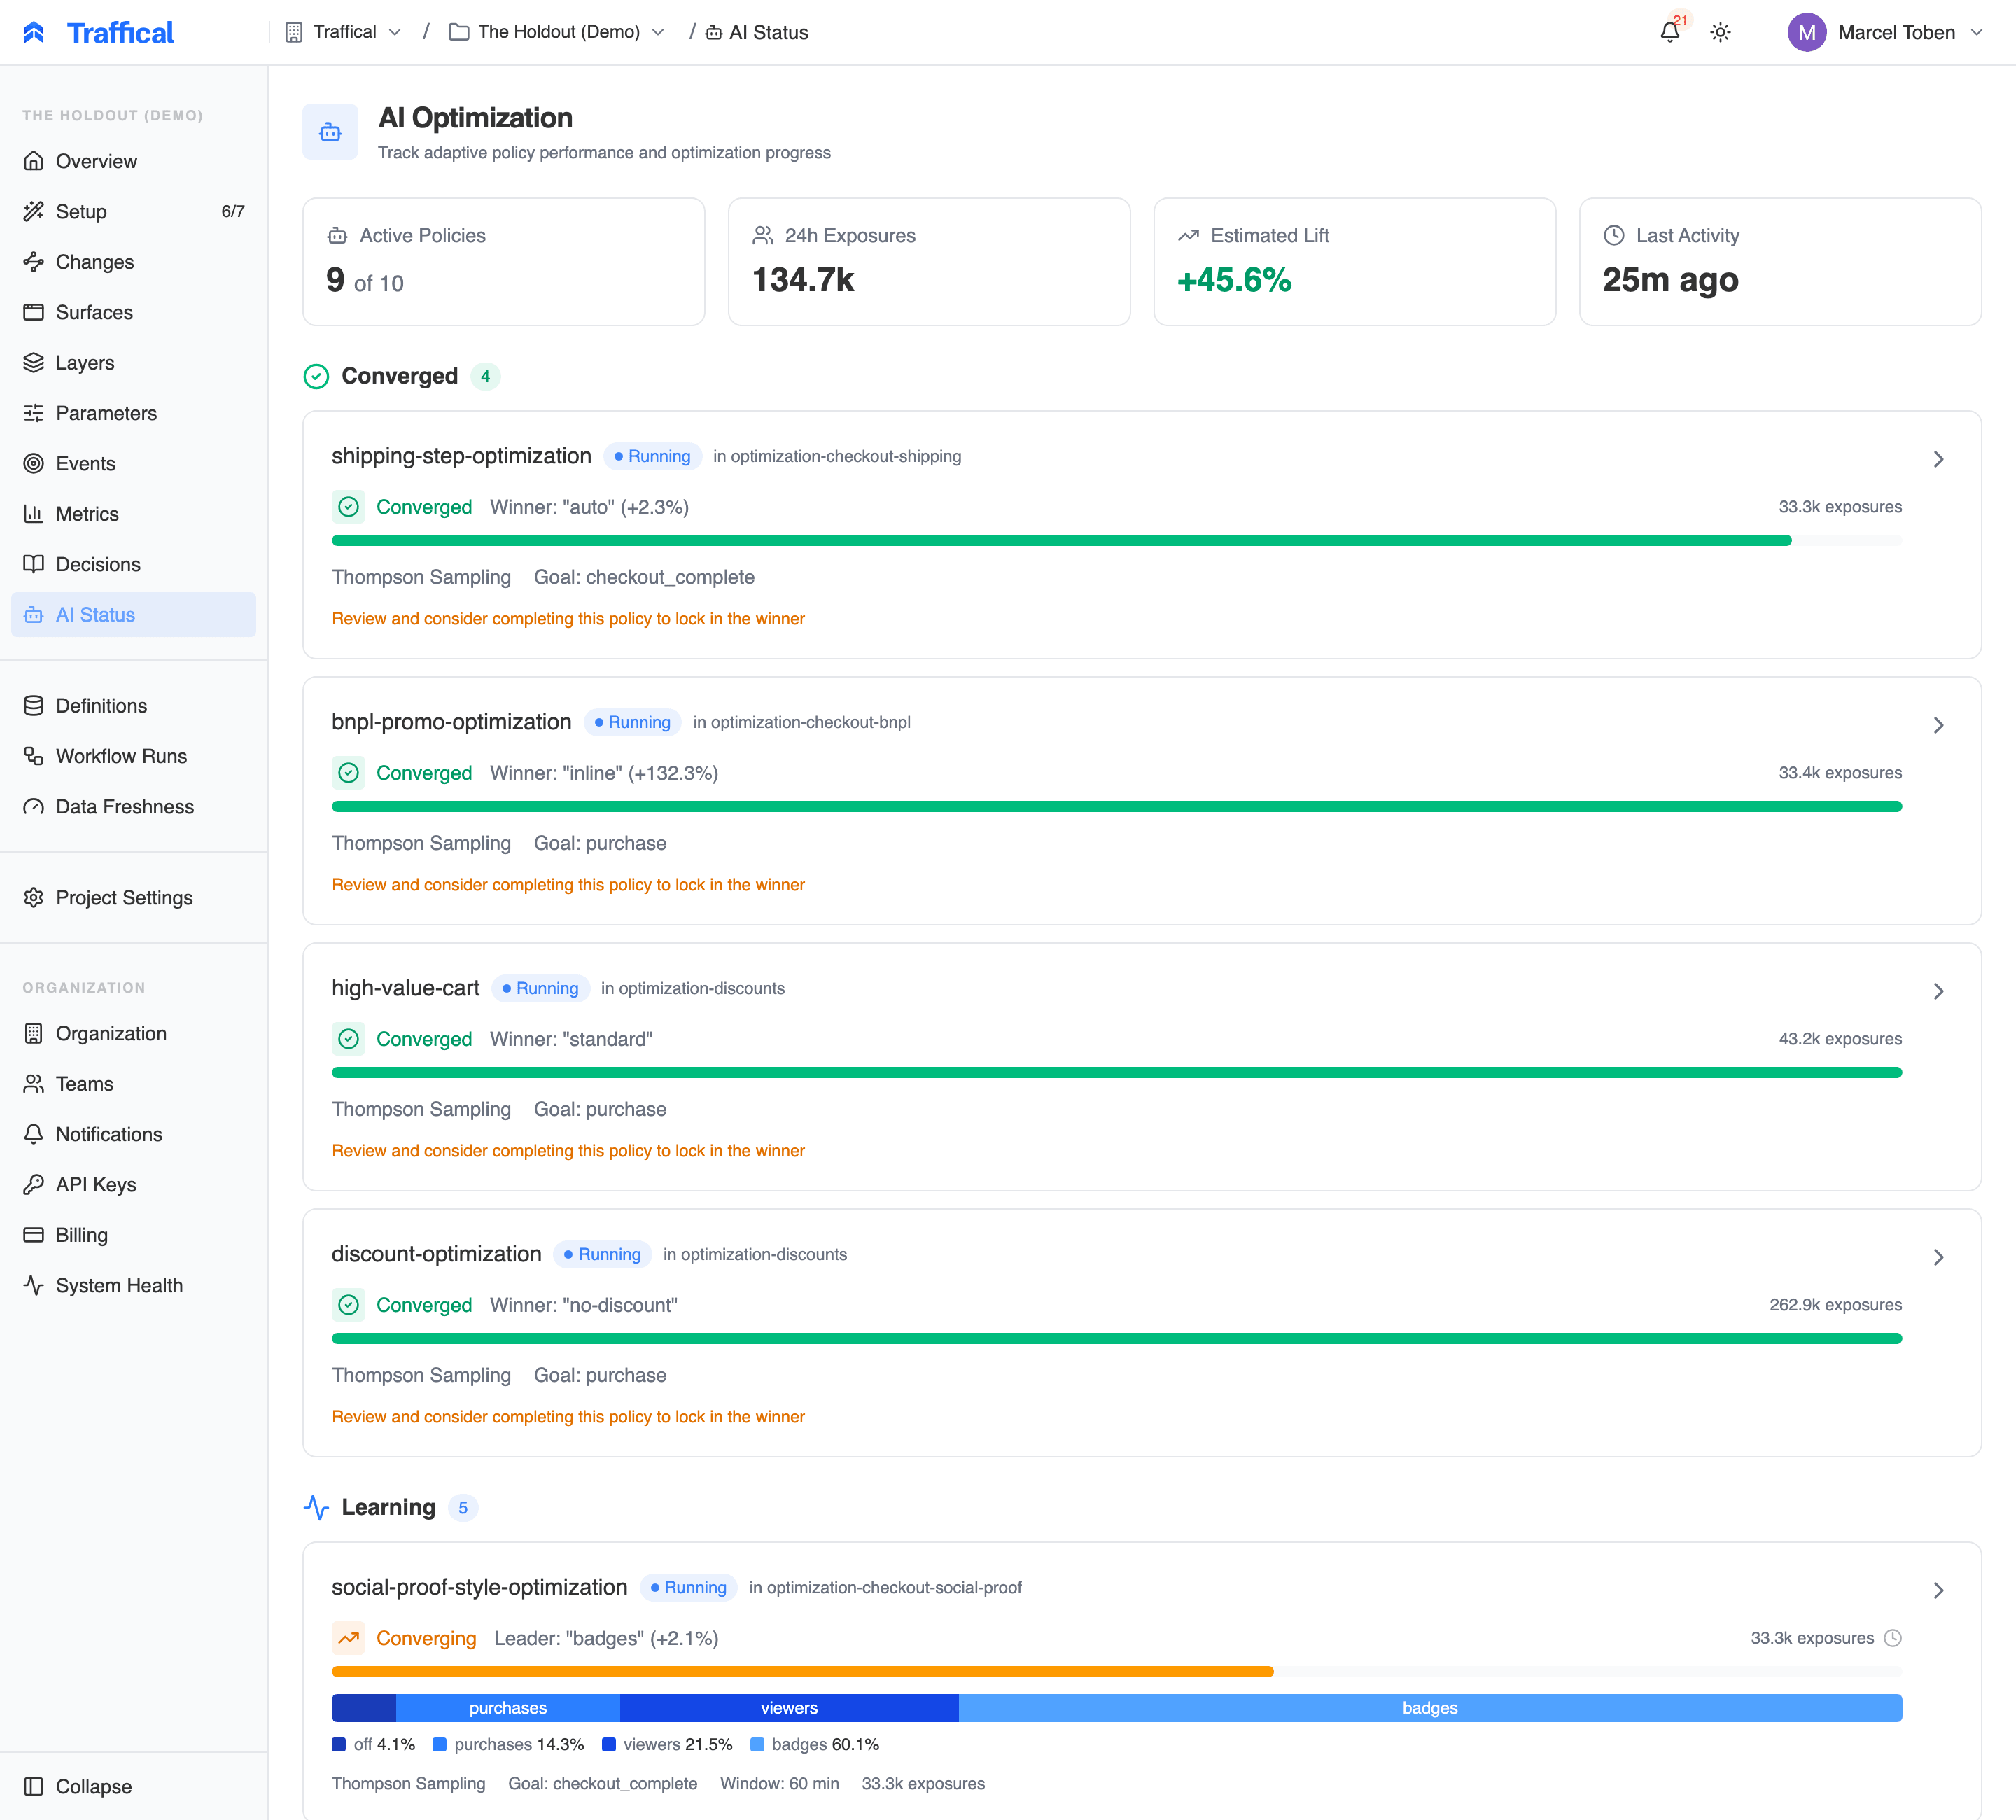 * **Converged** — the optimizer has settled: one allocation now carries most of the traffic. These prompt you to review the result and complete the policy to lock in the winner.
* **Learning** — still exploring: each card shows the live allocation split, the algorithm (Thompson Sampling, Epsilon Greedy, UCB1), the goal it optimizes, and exposures so far.
Above the groups, a summary strip totals running adaptive policies, 24-hour exposures, estimated lift, and the time of the optimizer's last action. Non-running policies collapse out of the way below, and a **Recent Activity** feed shows each traffic shift the optimizer made — previous split and new split side by side — so allocation moves are never a mystery. (Optimization milestones also land in the [decision log](/dashboard/decisions).)
Use this page as your daily check on autonomous optimization: is anything converged and waiting on you, is anything erroring, is the lift holding up. See [Choosing an algorithm](/experimentation/choosing-an-algorithm) for picking between the algorithms.
## Day-to-day flow
Most teams work like this:
1. **Author parameters in code** via `.traffical/config.yaml` and `traffical push`.
2. **Create policies in the dashboard** — that's where experiments are configured.
3. **Watch metrics during the experiment** — visit the policy detail page.
4. **Promote the winner** — update the parameter default and mark the policy complete.
Parameters live in code (the source of truth). Policies live in the dashboard (because they change frequently and need approval workflows). Events and metric definitions can live in either, depending on team preference.
## Roles
Every member of your organization holds one role — **Viewer**, **Member**, **Admin**, or **Owner**. Viewers read everything, members do the day-to-day building, and a small operate tier — starting live traffic, executing change transitions, promoting defaults — is reserved for admins and owners. Teams can narrow write access further by owning parameter groups. The full model, including API key scopes, is in [Roles, teams & API key scopes](/governance/roles-and-permissions).
## Audit trail
Every change in the dashboard is captured in the [decision log](/dashboard/decisions) — policy state transitions, allocation overrides, rollout actions, manual completions, optimization milestones. Use it to answer "who turned this on / who paused it / who promoted that variant".
## Next steps
The end-to-end flow from `traffical init` to reading results.
Walkthrough of the parameters page.
Where experiments live.
Connect Postgres, BigQuery, Snowflake, Databricks, or ClickHouse.
* **Converged** — the optimizer has settled: one allocation now carries most of the traffic. These prompt you to review the result and complete the policy to lock in the winner.
* **Learning** — still exploring: each card shows the live allocation split, the algorithm (Thompson Sampling, Epsilon Greedy, UCB1), the goal it optimizes, and exposures so far.
Above the groups, a summary strip totals running adaptive policies, 24-hour exposures, estimated lift, and the time of the optimizer's last action. Non-running policies collapse out of the way below, and a **Recent Activity** feed shows each traffic shift the optimizer made — previous split and new split side by side — so allocation moves are never a mystery. (Optimization milestones also land in the [decision log](/dashboard/decisions).)
Use this page as your daily check on autonomous optimization: is anything converged and waiting on you, is anything erroring, is the lift holding up. See [Choosing an algorithm](/experimentation/choosing-an-algorithm) for picking between the algorithms.
## Day-to-day flow
Most teams work like this:
1. **Author parameters in code** via `.traffical/config.yaml` and `traffical push`.
2. **Create policies in the dashboard** — that's where experiments are configured.
3. **Watch metrics during the experiment** — visit the policy detail page.
4. **Promote the winner** — update the parameter default and mark the policy complete.
Parameters live in code (the source of truth). Policies live in the dashboard (because they change frequently and need approval workflows). Events and metric definitions can live in either, depending on team preference.
## Roles
Every member of your organization holds one role — **Viewer**, **Member**, **Admin**, or **Owner**. Viewers read everything, members do the day-to-day building, and a small operate tier — starting live traffic, executing change transitions, promoting defaults — is reserved for admins and owners. Teams can narrow write access further by owning parameter groups. The full model, including API key scopes, is in [Roles, teams & API key scopes](/governance/roles-and-permissions).
## Audit trail
Every change in the dashboard is captured in the [decision log](/dashboard/decisions) — policy state transitions, allocation overrides, rollout actions, manual completions, optimization milestones. Use it to answer "who turned this on / who paused it / who promoted that variant".
## Next steps
The end-to-end flow from `traffical init` to reading results.
Walkthrough of the parameters page.
Where experiments live.
Connect Postgres, BigQuery, Snowflake, Databricks, or ClickHouse.