> ## Documentation Index
> Fetch the complete documentation index at: https://docs.traffical.io/llms.txt
> Use this file to discover all available pages before exploring further.
# Pipeline in the dashboard
> Watch workflow runs, inspect data freshness, adjust scheduling, and debug pipeline failures.
The **Pipeline** section of the sidebar is the operational view of metric computation. On a schedule, Traffical runs SQL against your warehouse — extracting assignments and facts, computing metric results, rolling up dashboards, and evaluating policy health. Use these pages to verify the pipeline is running, spot failures, and see how fresh your numbers are.
The section has three pages: **Definitions** (where the SQL is authored — see [Definitions](/dashboard/definitions)), **Workflow Runs**, and **Data Freshness**. This page covers the last two.
If your project has no active definitions or running policies, these pages are mostly empty — there's nothing to compute yet.
## What runs
Every execution appears as a **workflow run** with a type:
| Type | What it does |
| ---------------------- | ------------------------------------------------------------------------------------------------------------------------------- |
| **Analysis** | Computes configured metrics across policies for an analysis window — the run that produces experiment results and policy health |
| **Reanalyze** | Recomputes metrics from a prior run with new settings |
| **Assignment extract** | Extracts fresh assignment data — the shared input that analysis and dashboard rollups read |
| **Fact extract** | Extracts a fact definition's SQL into persistent fact-event storage |
| **Metric rollup** | Builds per-metric daily/hourly/lifetime time series for dashboards |
| **Dashboard rollup** | Pre-computes the project dashboard and event explorer |
| **Ingest** | Loads warehouse facts and metric aggregates |
| **Training** | Trains an adaptive-optimization model |
| **SDK event sync** | Syncs SDK events into your warehouse (when [enabled](/dashboard/settings#sdk-configuration)) |
| **Usage rollup** | Meters monthly tracked units for [billing](/dashboard/usage-and-billing) |
## Workflow Runs
The **Workflow Runs** page lists recent executions, newest first, with a duration chart across the top. Filter by type or status, or search by run id.
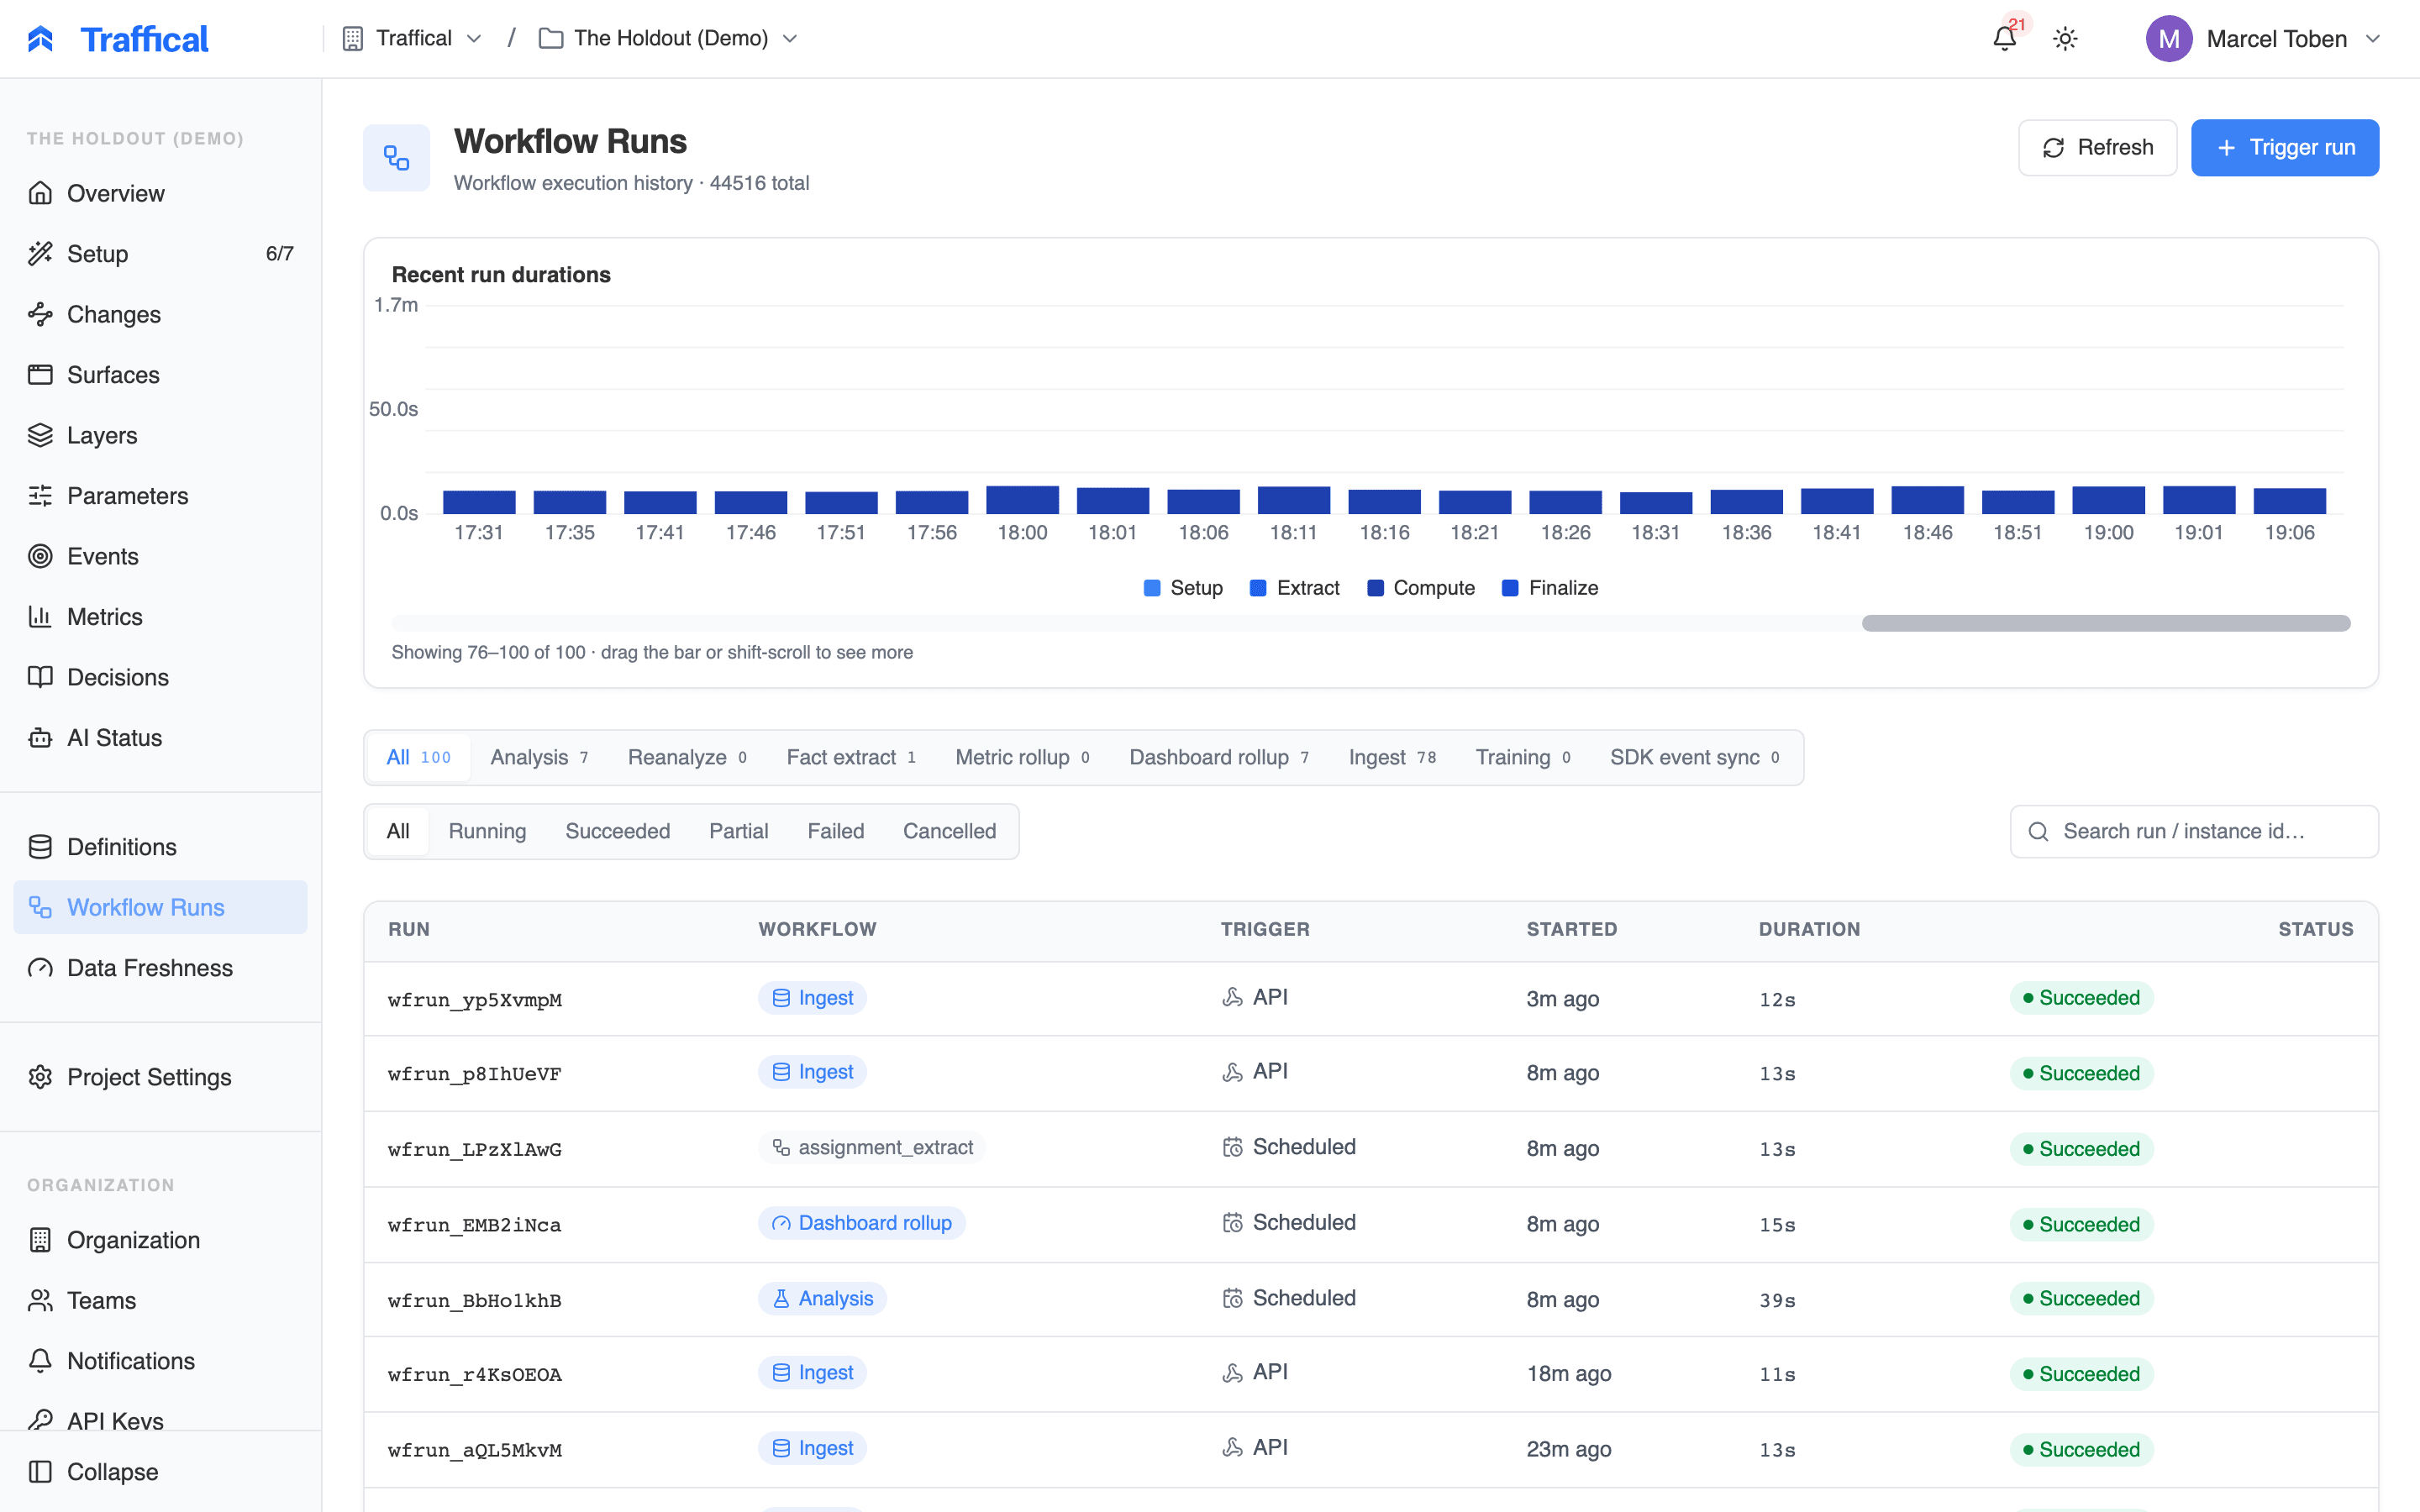 Each row shows the run id, workflow type, trigger (scheduled, manual, API, or restart), start time, duration, and status:
* `queued` / `running` — in progress; running rows are highlighted (click **Refresh** to update the list — the run detail page updates live)
* `succeeded` — everything completed
* `partial` — some of the run's work succeeded and some failed; the failures don't block the rest
* `failed` — the run errored
* `cancelled` / `terminated` — stopped before completing
A definition that keeps failing doesn't stall the whole pipeline — other definitions keep computing, and the run lands as `partial`.
## Run detail
Click a run to drill in.
Each row shows the run id, workflow type, trigger (scheduled, manual, API, or restart), start time, duration, and status:
* `queued` / `running` — in progress; running rows are highlighted (click **Refresh** to update the list — the run detail page updates live)
* `succeeded` — everything completed
* `partial` — some of the run's work succeeded and some failed; the failures don't block the rest
* `failed` — the run errored
* `cancelled` / `terminated` — stopped before completing
A definition that keeps failing doesn't stall the whole pipeline — other definitions keep computing, and the run lands as `partial`.
## Run detail
Click a run to drill in.
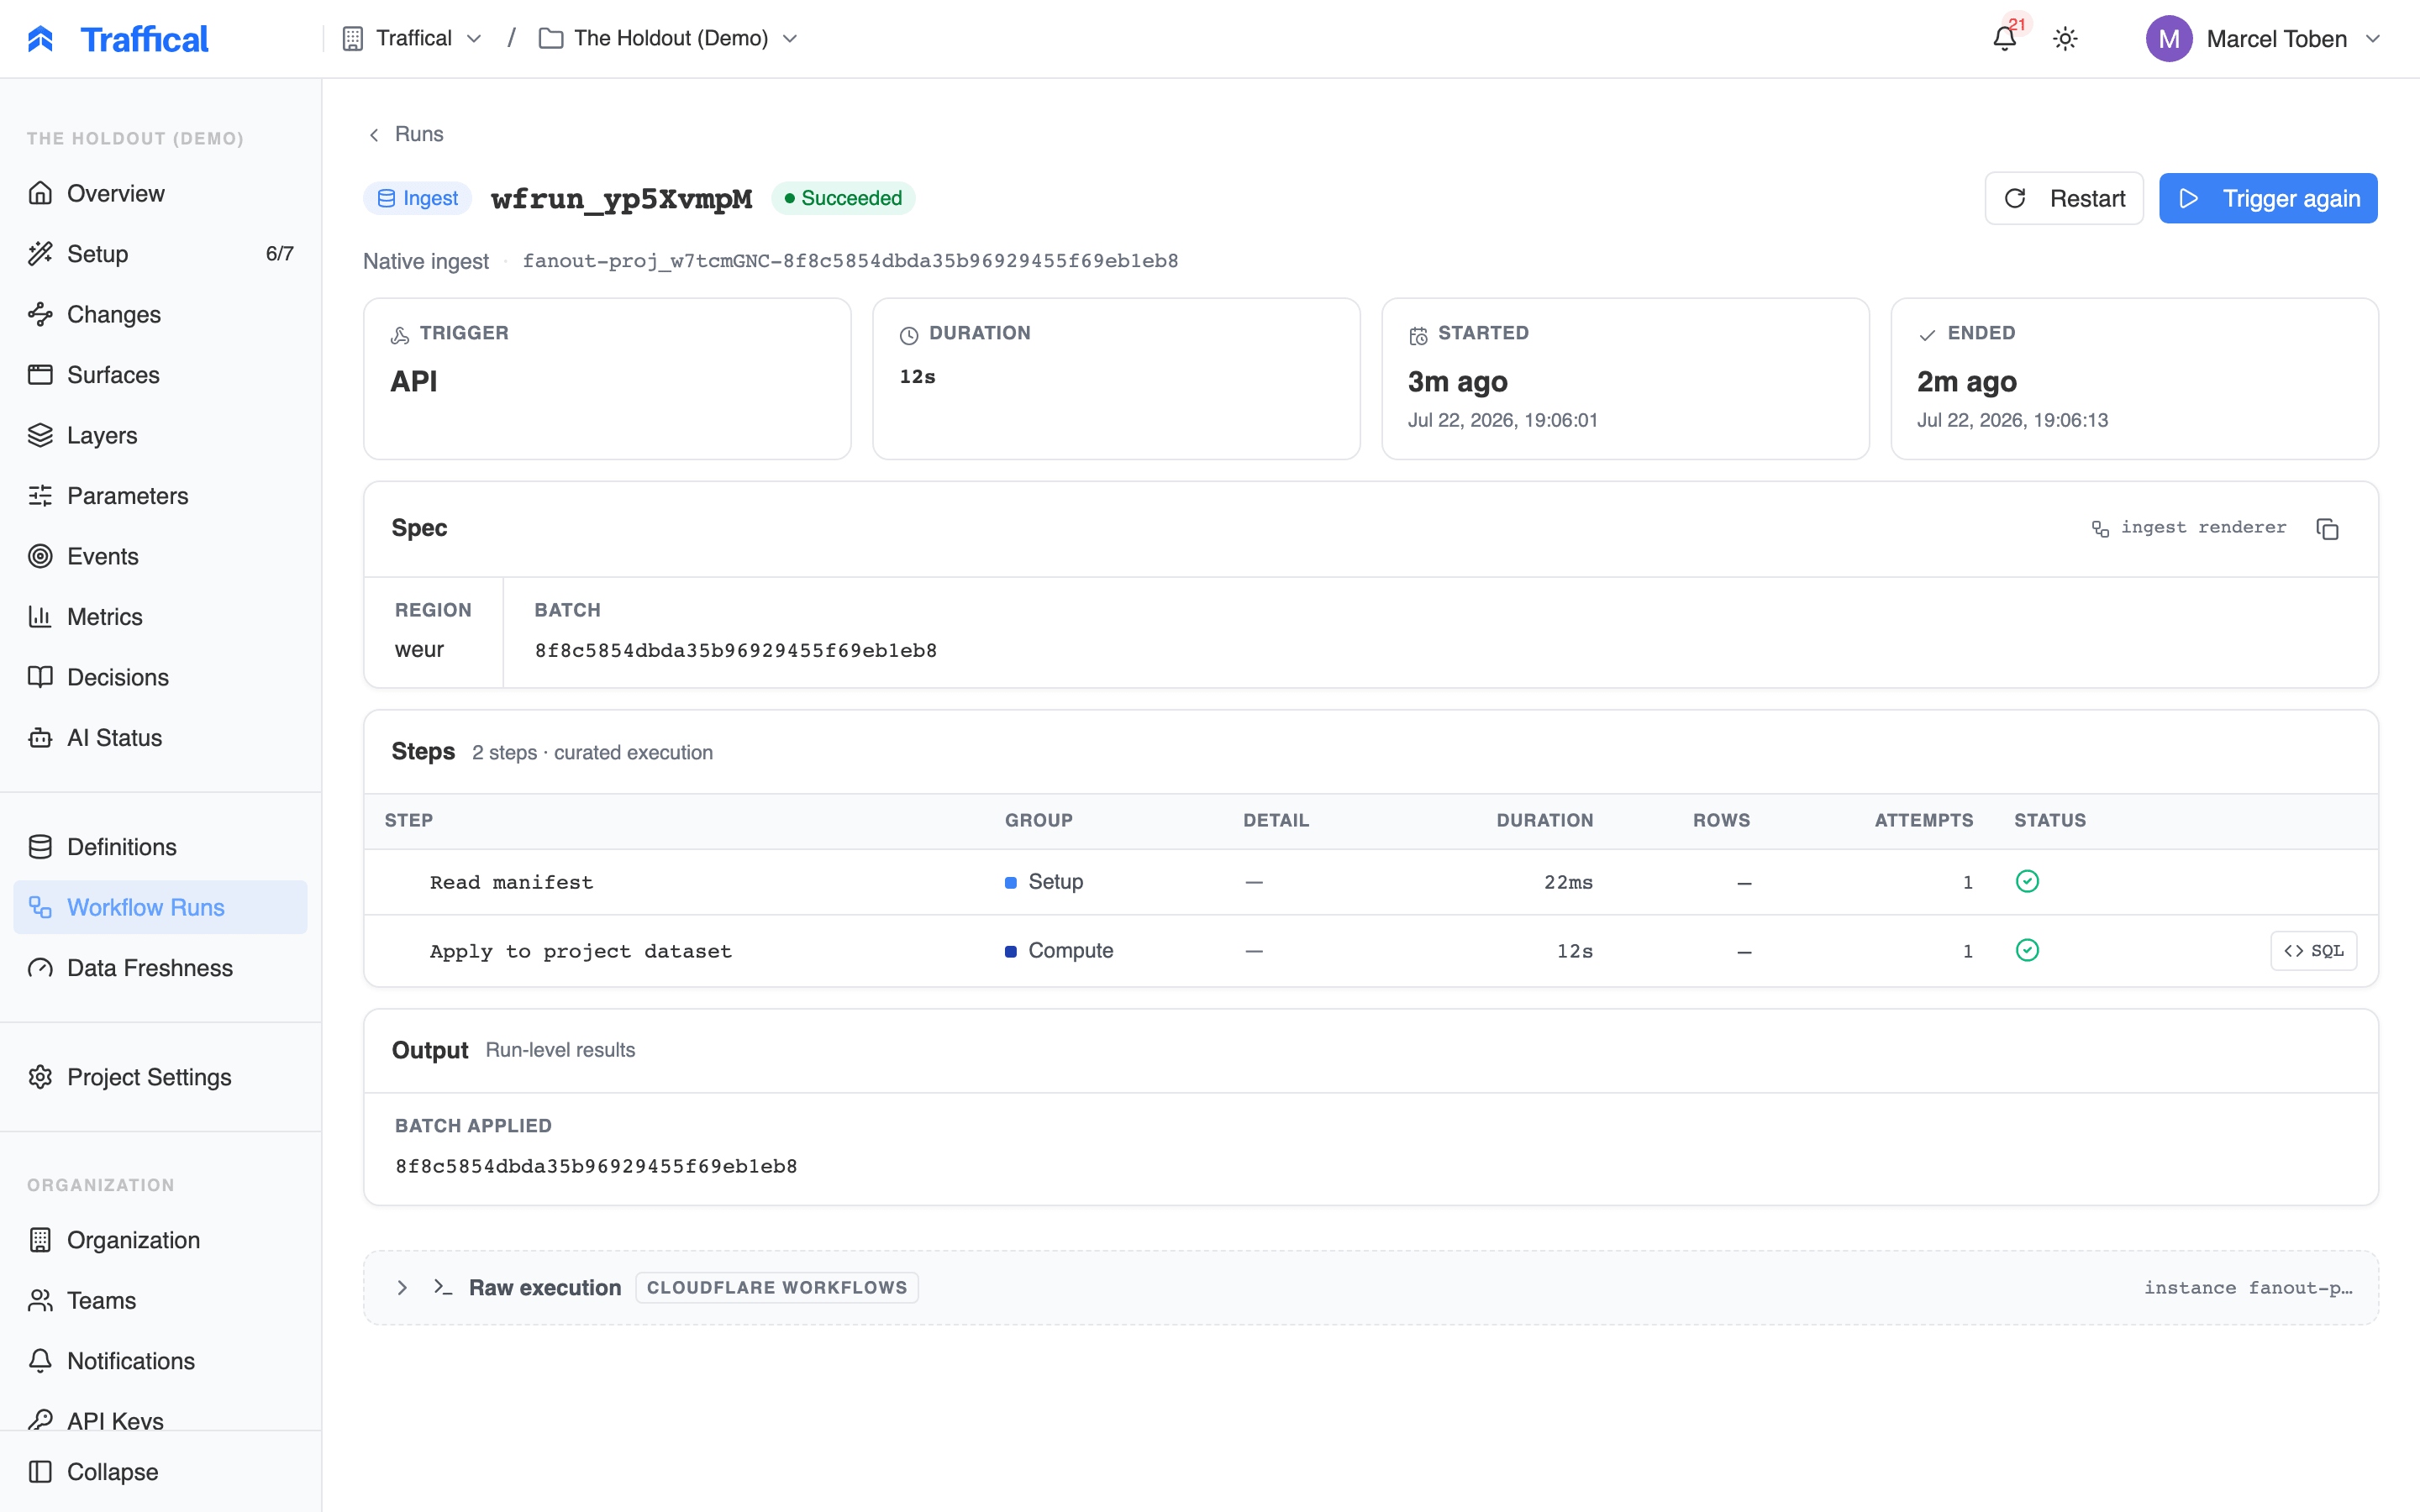 The header shows trigger, duration, and start/end times. Below it:
* **Spec** — what the run was asked to do, with links to the policies, metrics, and definitions involved
* **Steps** — the execution broken into setup, extract, compute, and finalize steps, each with duration, rows processed, attempt count, and status. Sub-steps expand inline; failed steps expand automatically with their error.
* **Output** — run-level results, again linked to the entities they touched
Steps that executed SQL have a **viewer**: click the step's SQL icon to open the rendered query (template variables already substituted), formatted and copyable. Paste it into your warehouse's own console to reproduce a failure or check what was scanned — the fastest way to debug a broken definition.
While a run is live, the page polls every few seconds, so you can watch steps complete.
### Restart, terminate, trigger again
From the run detail page:
* **Terminate** stops a running run. In-flight work is abandoned and the run is marked `terminated`.
* **Restart** re-runs a finished run from a step you choose — useful when a late step failed and the earlier extraction was fine.
* **Trigger again** opens the trigger dialog pre-filled with the same workflow type.
## Manual runs
Click **Trigger run** on the Workflow Runs page to start a run by hand. Pick a workflow type; each exposes a small set of options — for example, an analysis run can be **lite** (headline metrics) or **full** (all policies and metrics), and analysis and metric rollup offer a **Force full rebuild** toggle that drops persisted state and recomputes history. SDK sync offers a **Full resync** toggle instead: it drops the synced tables and re-reads a short lookback rather than all history. Full rebuilds are slow; normal runs are incremental.
Manual runs are useful for:
* Re-running after fixing a broken definition
* Pulling in late-arriving data after a backfill
* Verifying a freshly saved definition works against real data
Manual runs don't disturb the regular cadence — the next scheduled run proceeds as usual.
## Data Freshness
The **Data Freshness** page shows, per assignment and fact definition, how current the computed data is.
The header shows trigger, duration, and start/end times. Below it:
* **Spec** — what the run was asked to do, with links to the policies, metrics, and definitions involved
* **Steps** — the execution broken into setup, extract, compute, and finalize steps, each with duration, rows processed, attempt count, and status. Sub-steps expand inline; failed steps expand automatically with their error.
* **Output** — run-level results, again linked to the entities they touched
Steps that executed SQL have a **viewer**: click the step's SQL icon to open the rendered query (template variables already substituted), formatted and copyable. Paste it into your warehouse's own console to reproduce a failure or check what was scanned — the fastest way to debug a broken definition.
While a run is live, the page polls every few seconds, so you can watch steps complete.
### Restart, terminate, trigger again
From the run detail page:
* **Terminate** stops a running run. In-flight work is abandoned and the run is marked `terminated`.
* **Restart** re-runs a finished run from a step you choose — useful when a late step failed and the earlier extraction was fine.
* **Trigger again** opens the trigger dialog pre-filled with the same workflow type.
## Manual runs
Click **Trigger run** on the Workflow Runs page to start a run by hand. Pick a workflow type; each exposes a small set of options — for example, an analysis run can be **lite** (headline metrics) or **full** (all policies and metrics), and analysis and metric rollup offer a **Force full rebuild** toggle that drops persisted state and recomputes history. SDK sync offers a **Full resync** toggle instead: it drops the synced tables and re-reads a short lookback rather than all history. Full rebuilds are slow; normal runs are incremental.
Manual runs are useful for:
* Re-running after fixing a broken definition
* Pulling in late-arriving data after a backfill
* Verifying a freshly saved definition works against real data
Manual runs don't disturb the regular cadence — the next scheduled run proceeds as usual.
## Data Freshness
The **Data Freshness** page shows, per assignment and fact definition, how current the computed data is.
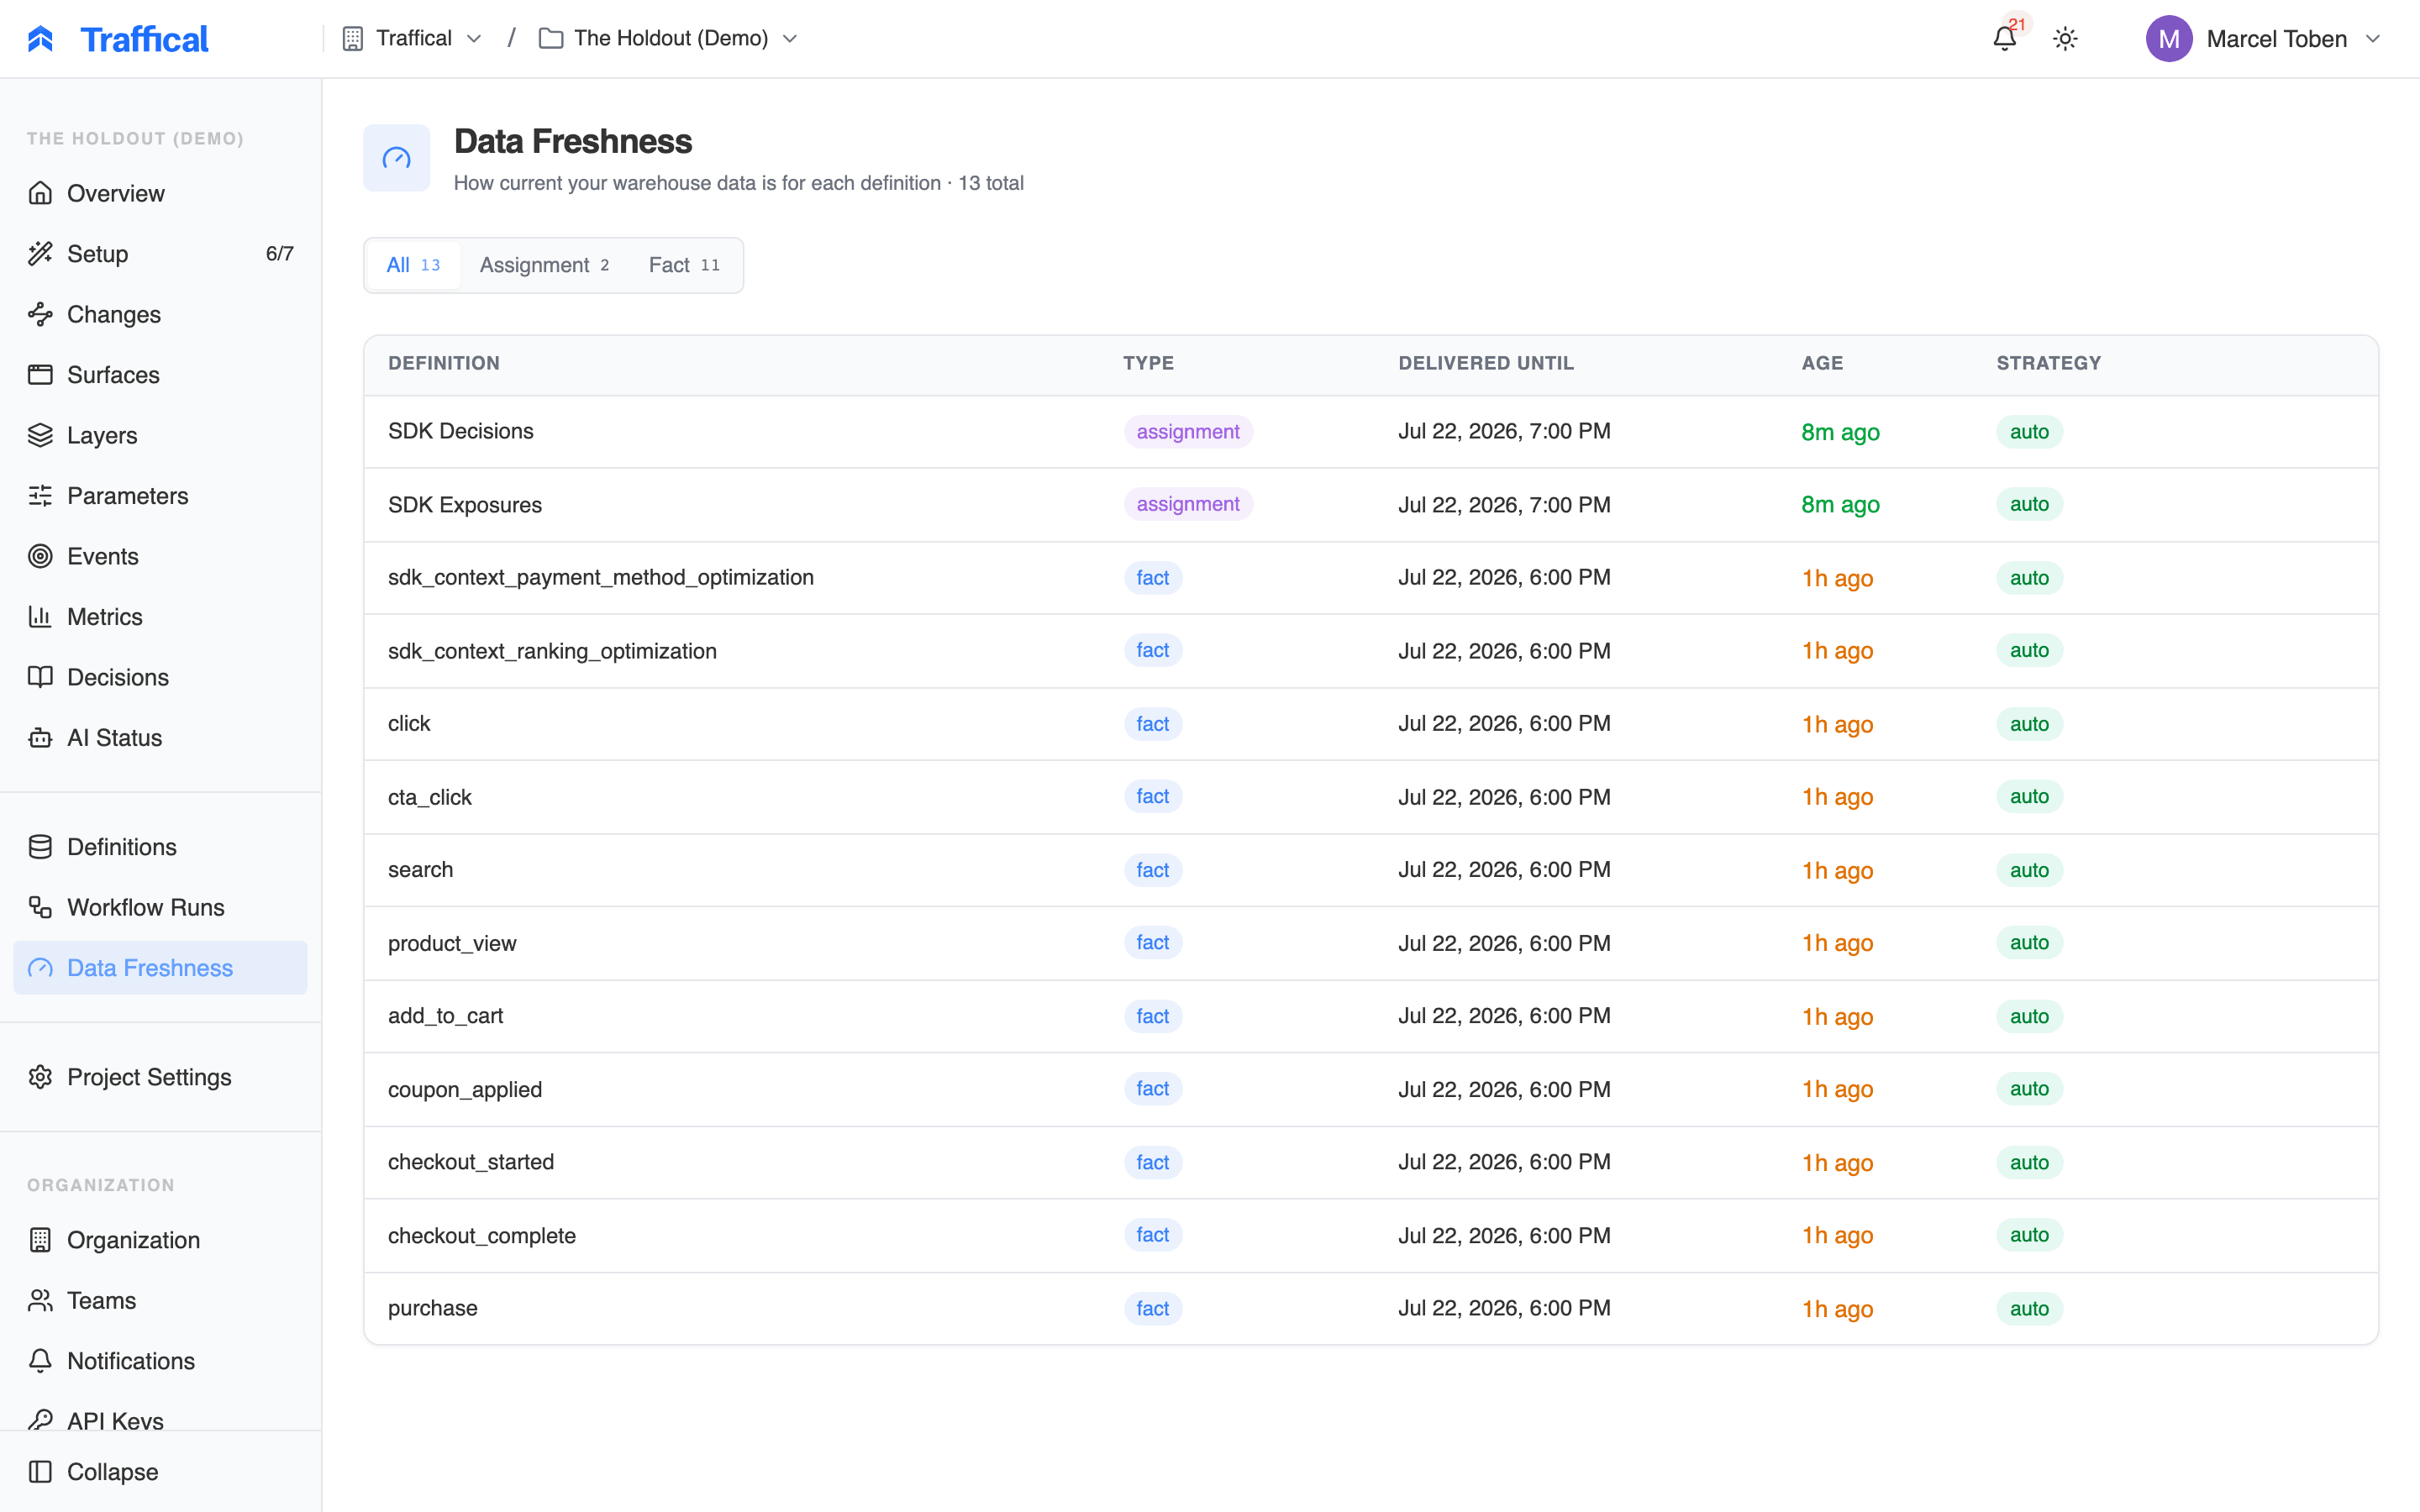 Each definition carries a **delivered-until** watermark: data is considered delivered up to that timestamp, and the next analysis run resumes ingesting from there (with an overlap, so late data near the mark is still caught). A stalled mark doesn't lose data — each run re-reads a widening window until the mark moves again, which costs compute rather than correctness. The **Age** column colors the gap — green under 15 minutes, amber up to two hours, red beyond.
The **Strategy** column shows how the watermark advances:
* **auto** — successful analysis runs advance it. If runs fail, the watermark holds where it is; a mark that stops moving is your cue to check **Workflow Runs** for the failure.
* **manual** — the mark is set explicitly rather than advanced by runs. Manual marks show a pencil so you can adjust the timestamp yourself.
A new definition has no freshness mark until its first successful analysis run.
If [SDK event sync](/dashboard/settings#sdk-configuration) is enabled for your warehouse, a sources card at the top shows sync health — every definition reading from the synced tables can only be as fresh as the sync itself.
### When numbers lag
If a metric looks stale on the [Metrics](/dashboard/metrics) page or a policy's [measurement progress](/statistics/measurement-progress) has stopped advancing:
1. Check **Data Freshness** — is the relevant definition's watermark moving?
2. If not, open **Workflow Runs** filtered to `failed`/`partial` and look at the failing step's error and rendered SQL.
3. Common causes: warehouse credential rotated, table renamed in a migration, column changed type.
Pipeline failures can also notify you directly — see [Notifications](/dashboard/notifications). For a broader symptom-by-symptom guide, see [Troubleshooting](/reference/troubleshooting).
## Scheduling
Each workflow kind has a default cadence:
| Workflow | Default | Override range |
| ------------------ | -------------------------------------------------------------------------------------------------- | -------------- |
| Analysis | Auto — every 5 minutes for projects with adaptive policies, every 15 minutes for A/B-only projects | 5 min – 1 h |
| Dashboard rollup | 5 min | 5 min – 1 h |
| Assignment extract | 5 min | 5 min – 1 h |
| Fact extract | 15 min | 15 min – 12 h |
| Metric rollup | 1 h | 1 h – 24 h |
| SDK sync | 5 min | 5 min – 1 h |
| Usage metering | 6 h | 1 h – 48 h |
Adaptive policies get the faster analysis lane by default because the optimizer acts on the results; A/B results only need to be as fresh as your reading of them.
Override any cadence in **Settings → Pipeline scheduling** ([Settings](/dashboard/settings)). Longer intervals cut warehouse cost; shorter intervals keep dashboards fresher. One guard applies: the assignment extract feeds analysis and dashboard rollups, so it can't be scheduled less often than either of them.
Each definition carries a **delivered-until** watermark: data is considered delivered up to that timestamp, and the next analysis run resumes ingesting from there (with an overlap, so late data near the mark is still caught). A stalled mark doesn't lose data — each run re-reads a widening window until the mark moves again, which costs compute rather than correctness. The **Age** column colors the gap — green under 15 minutes, amber up to two hours, red beyond.
The **Strategy** column shows how the watermark advances:
* **auto** — successful analysis runs advance it. If runs fail, the watermark holds where it is; a mark that stops moving is your cue to check **Workflow Runs** for the failure.
* **manual** — the mark is set explicitly rather than advanced by runs. Manual marks show a pencil so you can adjust the timestamp yourself.
A new definition has no freshness mark until its first successful analysis run.
If [SDK event sync](/dashboard/settings#sdk-configuration) is enabled for your warehouse, a sources card at the top shows sync health — every definition reading from the synced tables can only be as fresh as the sync itself.
### When numbers lag
If a metric looks stale on the [Metrics](/dashboard/metrics) page or a policy's [measurement progress](/statistics/measurement-progress) has stopped advancing:
1. Check **Data Freshness** — is the relevant definition's watermark moving?
2. If not, open **Workflow Runs** filtered to `failed`/`partial` and look at the failing step's error and rendered SQL.
3. Common causes: warehouse credential rotated, table renamed in a migration, column changed type.
Pipeline failures can also notify you directly — see [Notifications](/dashboard/notifications). For a broader symptom-by-symptom guide, see [Troubleshooting](/reference/troubleshooting).
## Scheduling
Each workflow kind has a default cadence:
| Workflow | Default | Override range |
| ------------------ | -------------------------------------------------------------------------------------------------- | -------------- |
| Analysis | Auto — every 5 minutes for projects with adaptive policies, every 15 minutes for A/B-only projects | 5 min – 1 h |
| Dashboard rollup | 5 min | 5 min – 1 h |
| Assignment extract | 5 min | 5 min – 1 h |
| Fact extract | 15 min | 15 min – 12 h |
| Metric rollup | 1 h | 1 h – 24 h |
| SDK sync | 5 min | 5 min – 1 h |
| Usage metering | 6 h | 1 h – 48 h |
Adaptive policies get the faster analysis lane by default because the optimizer acts on the results; A/B results only need to be as fresh as your reading of them.
Override any cadence in **Settings → Pipeline scheduling** ([Settings](/dashboard/settings)). Longer intervals cut warehouse cost; shorter intervals keep dashboards fresher. One guard applies: the assignment extract feeds analysis and dashboard rollups, so it can't be scheduled less often than either of them.
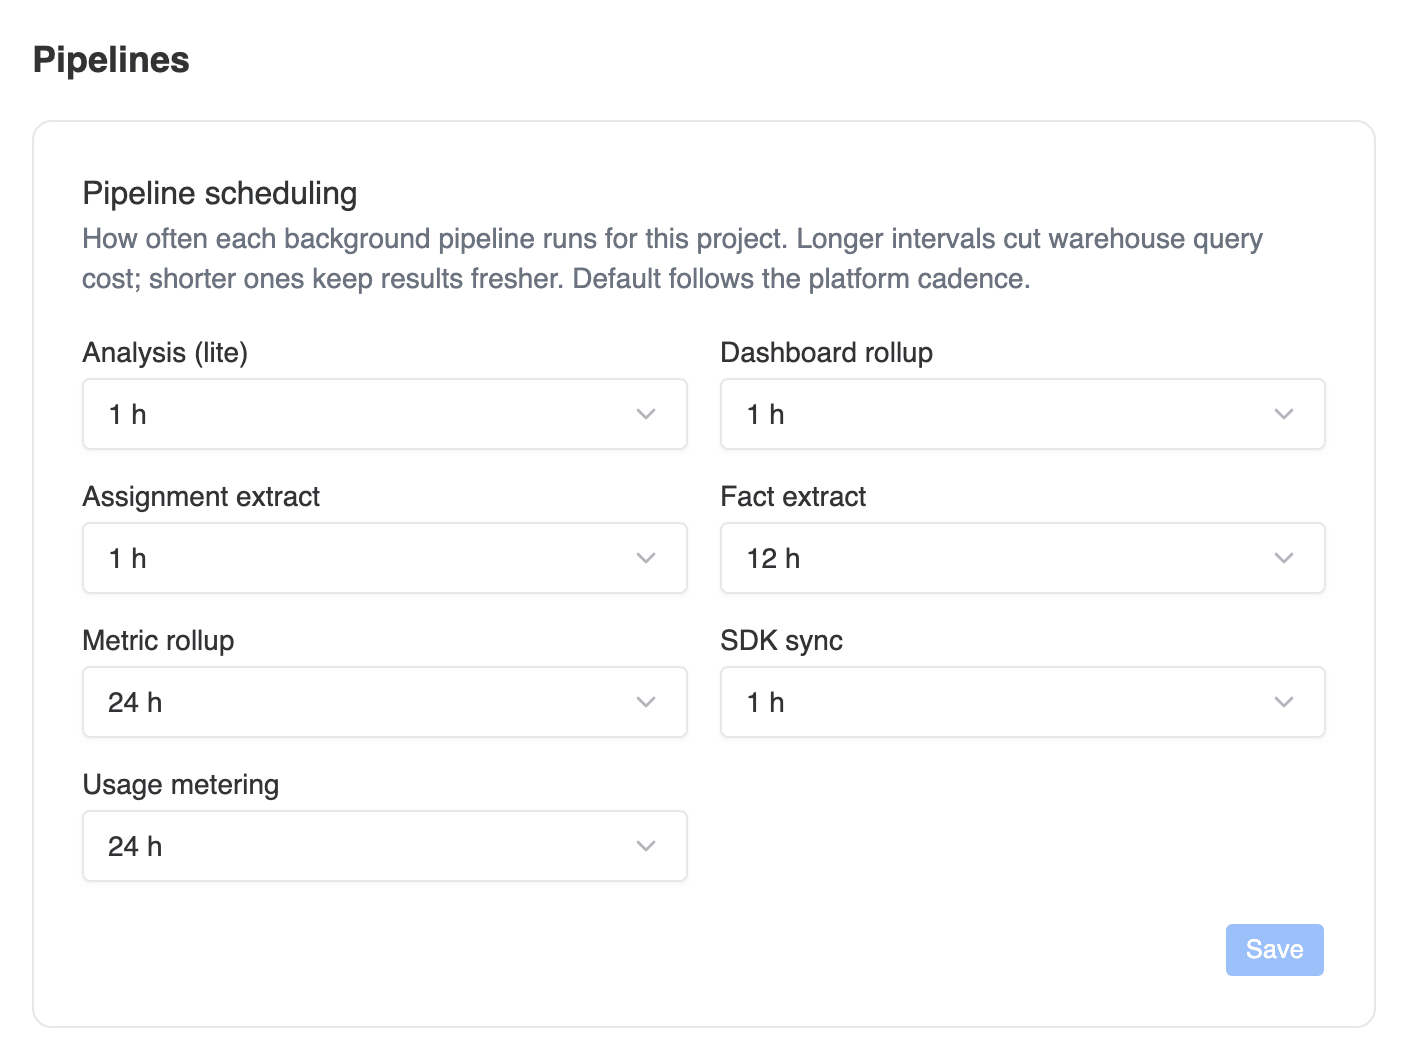 Scheduled runs only fire when **Automatic pipeline runs** is enabled on the warehouse connection (**Settings → Warehouse**). Manual triggers work either way.
Cadence is the main cost lever, but expensive SQL compounds with every run. If a definition is costly, open a recent run's rendered SQL and check that it filters on your table's partitioned or clustered time column — a full-table scan every 15 minutes adds up. See [Connectors](/connectors/overview) for per-warehouse tuning.
## Next steps
Where the SQL is authored.
What the pipeline ultimately produces.
Pipeline scheduling and warehouse connection.
When something looks wrong.
Scheduled runs only fire when **Automatic pipeline runs** is enabled on the warehouse connection (**Settings → Warehouse**). Manual triggers work either way.
Cadence is the main cost lever, but expensive SQL compounds with every run. If a definition is costly, open a recent run's rendered SQL and check that it filters on your table's partitioned or clustered time column — a full-table scan every 15 minutes adds up. See [Connectors](/connectors/overview) for per-warehouse tuning.
## Next steps
Where the SQL is authored.
What the pipeline ultimately produces.
Pipeline scheduling and warehouse connection.
When something looks wrong.