> ## Documentation Index
> Fetch the complete documentation index at: https://docs.traffical.io/llms.txt
> Use this file to discover all available pages before exploring further.
# Project settings
> Change defaults, analysis defaults, pipeline scheduling, SDK and warehouse configuration, entities, and maintenance — per-project configuration in one place.
The **Settings** section collects per-project configuration across five tabs — **General**, **Entities**, **Warehouse**, **SDK**, and **Maintenance**. Viewing is open to everyone with project access; editing needs the member role or above. In permission terms, most tabs check `projects:write` — the **Warehouse** tab checks `warehouse:write`, and creating entities checks `definitions:write`. See [Roles and permissions](/governance/roles-and-permissions).
 API keys are managed at the organization level, not in project settings — see [Projects & environments](/concepts/projects-and-environments#api-keys). Notification preferences also have their own page: [Notifications](/dashboard/notifications).
## Project basics
The **General** tab opens with read-only facts: project name, key, and creation date, followed by the **randomization unit** — the primary entity, its unit key (the context field the SDK hashes on, e.g. `userId`), key type, bucket count, and the primary [assignment definition](/concepts/assignments). The unit key and entity are set at project creation and can't be changed afterwards.
A **Surfaces** card links to surface management — the product and system contexts where parameters are consumed. See [Surfaces](/concepts/surfaces).
## Change defaults
The **Changes** card sets project-wide guardrails that the [New Change wizard](/dashboard/changes#the-new-change-wizard) reads every time someone drafts a [change](/concepts/changes).
API keys are managed at the organization level, not in project settings — see [Projects & environments](/concepts/projects-and-environments#api-keys). Notification preferences also have their own page: [Notifications](/dashboard/notifications).
## Project basics
The **General** tab opens with read-only facts: project name, key, and creation date, followed by the **randomization unit** — the primary entity, its unit key (the context field the SDK hashes on, e.g. `userId`), key type, bucket count, and the primary [assignment definition](/concepts/assignments). The unit key and entity are set at project creation and can't be changed afterwards.
A **Surfaces** card links to surface management — the product and system contexts where parameters are consumed. See [Surfaces](/concepts/surfaces).
## Change defaults
The **Changes** card sets project-wide guardrails that the [New Change wizard](/dashboard/changes#the-new-change-wizard) reads every time someone drafts a [change](/concepts/changes).
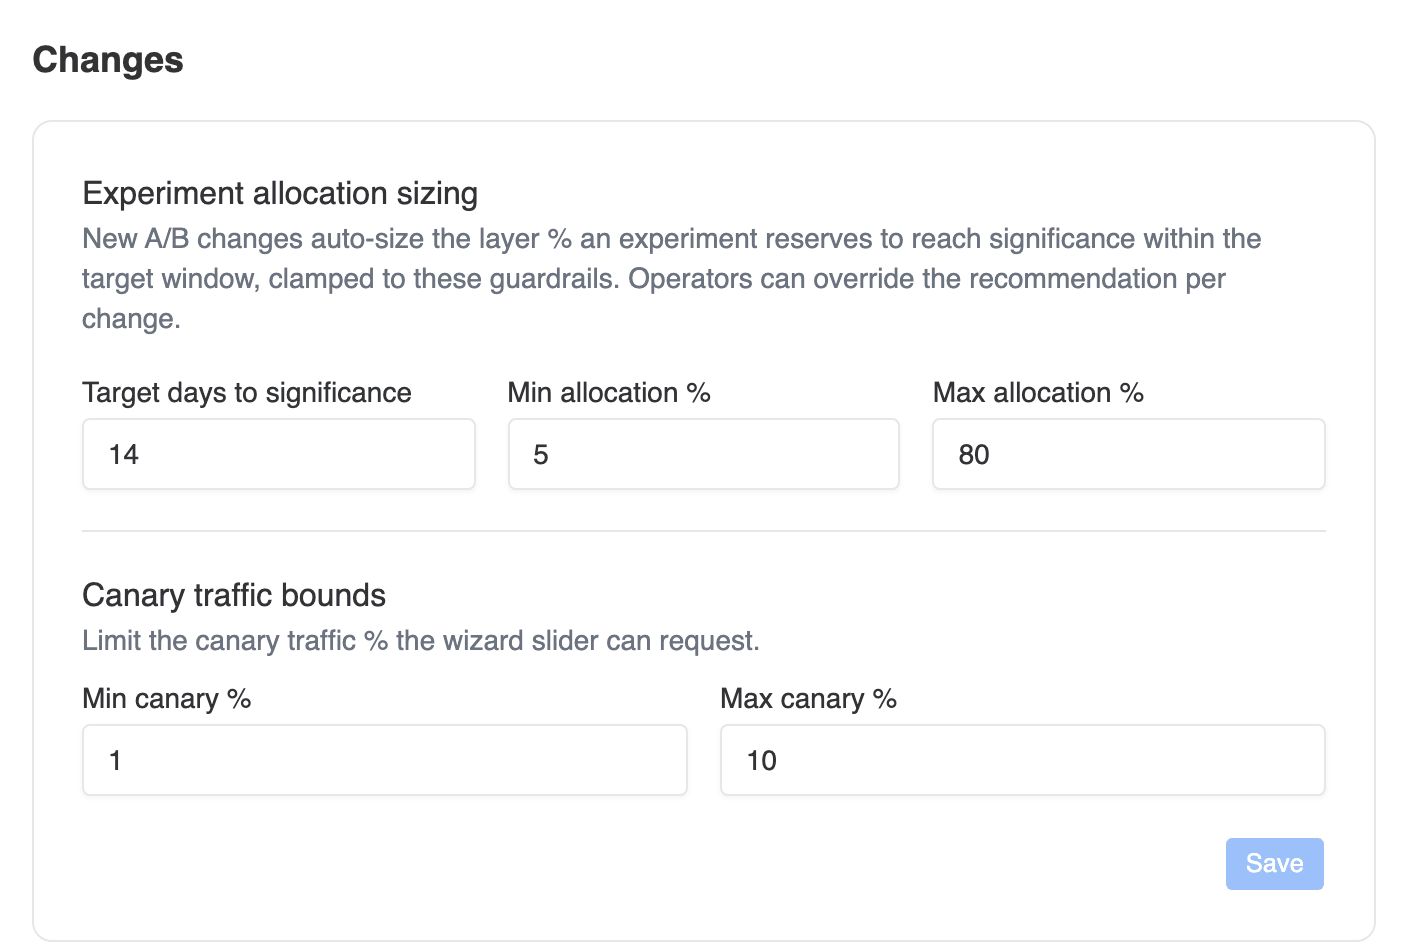 | Setting | Default | What it drives |
| ------------------------------- | ------- | ---------------------------------------------------------------------------------------------------------------------------------------------------------------------------------------------------------------------------------- |
| **Target days to significance** | 14 | New A/B changes auto-size the experiment allocation — the share of the layer the test reserves — so the experiment projects to reach significance within this many days, based on measured traffic and the goal metric's baseline. |
| **Min / max allocation %** | 5 / 80 | Clamp the auto-sized recommendation and bound the wizard's **Experiment allocation** slider. When the recommendation gets clamped, the wizard says so and shows the projected duration at the clamped value. |
| **Min / max canary %** | 1 / 10 | Bound the wizard's **Canary traffic** slider — the initial exposure a canary phase can request. |
These are guardrails, not mandates: operators can drag the sliders to override the recommendation per change, within the bounds you set here. The card refuses to save a min above its max.
## Analysis defaults
The **Analysis** card sets project-wide statistics defaults. Each policy inherits them unless it overrides the setting explicitly — the effective rule is always *policy setting if set, otherwise the project default*.
* **CUPED variance reduction** — use pre-experiment data to shrink confidence intervals and reach significance sooner, without biasing results. Off by default. See [Variance reduction (CUPED)](/statistics/cuped).
* **Sequential testing** — anytime-valid results: peek as often as you like and the false-positive rate still holds, in exchange for slightly wider intervals. Off by default. See [Sequential testing](/statistics/sequential-testing).
* **Default target MDE (%)** — the minimum detectable effect that [measurement progress](/statistics/measurement-progress) tracks against when nothing more specific sets one. The precedence is: the [measurement protocol](/governance/measurement-protocols), then the policy's metric attachment, then the metric definition, then this project default. Leave it empty to fall back to the 5% system default.
## Serving mode
The **Serving** card declares who actuates traffic for this project. Leave it on **Traffical SDK** whenever the SDK serves configuration — including bring-your-own-warehouse setups where assignment data flows through your own pipeline. Switch to **External** only when another system entirely decides who sees what and Traffical purely measures: adaptive policies then can't start, and the optimizer skips the project.
## Pipeline scheduling
The **Pipelines** card controls how often each background pipeline stage runs for this project. Longer intervals cut warehouse query cost; shorter ones keep results fresher. See [Pipeline](/dashboard/pipeline) for what the stages produce.
| Setting | Default | What it drives |
| ------------------------------- | ------- | ---------------------------------------------------------------------------------------------------------------------------------------------------------------------------------------------------------------------------------- |
| **Target days to significance** | 14 | New A/B changes auto-size the experiment allocation — the share of the layer the test reserves — so the experiment projects to reach significance within this many days, based on measured traffic and the goal metric's baseline. |
| **Min / max allocation %** | 5 / 80 | Clamp the auto-sized recommendation and bound the wizard's **Experiment allocation** slider. When the recommendation gets clamped, the wizard says so and shows the projected duration at the clamped value. |
| **Min / max canary %** | 1 / 10 | Bound the wizard's **Canary traffic** slider — the initial exposure a canary phase can request. |
These are guardrails, not mandates: operators can drag the sliders to override the recommendation per change, within the bounds you set here. The card refuses to save a min above its max.
## Analysis defaults
The **Analysis** card sets project-wide statistics defaults. Each policy inherits them unless it overrides the setting explicitly — the effective rule is always *policy setting if set, otherwise the project default*.
* **CUPED variance reduction** — use pre-experiment data to shrink confidence intervals and reach significance sooner, without biasing results. Off by default. See [Variance reduction (CUPED)](/statistics/cuped).
* **Sequential testing** — anytime-valid results: peek as often as you like and the false-positive rate still holds, in exchange for slightly wider intervals. Off by default. See [Sequential testing](/statistics/sequential-testing).
* **Default target MDE (%)** — the minimum detectable effect that [measurement progress](/statistics/measurement-progress) tracks against when nothing more specific sets one. The precedence is: the [measurement protocol](/governance/measurement-protocols), then the policy's metric attachment, then the metric definition, then this project default. Leave it empty to fall back to the 5% system default.
## Serving mode
The **Serving** card declares who actuates traffic for this project. Leave it on **Traffical SDK** whenever the SDK serves configuration — including bring-your-own-warehouse setups where assignment data flows through your own pipeline. Switch to **External** only when another system entirely decides who sees what and Traffical purely measures: adaptive policies then can't start, and the optimizer skips the project.
## Pipeline scheduling
The **Pipelines** card controls how often each background pipeline stage runs for this project. Longer intervals cut warehouse query cost; shorter ones keep results fresher. See [Pipeline](/dashboard/pipeline) for what the stages produce.
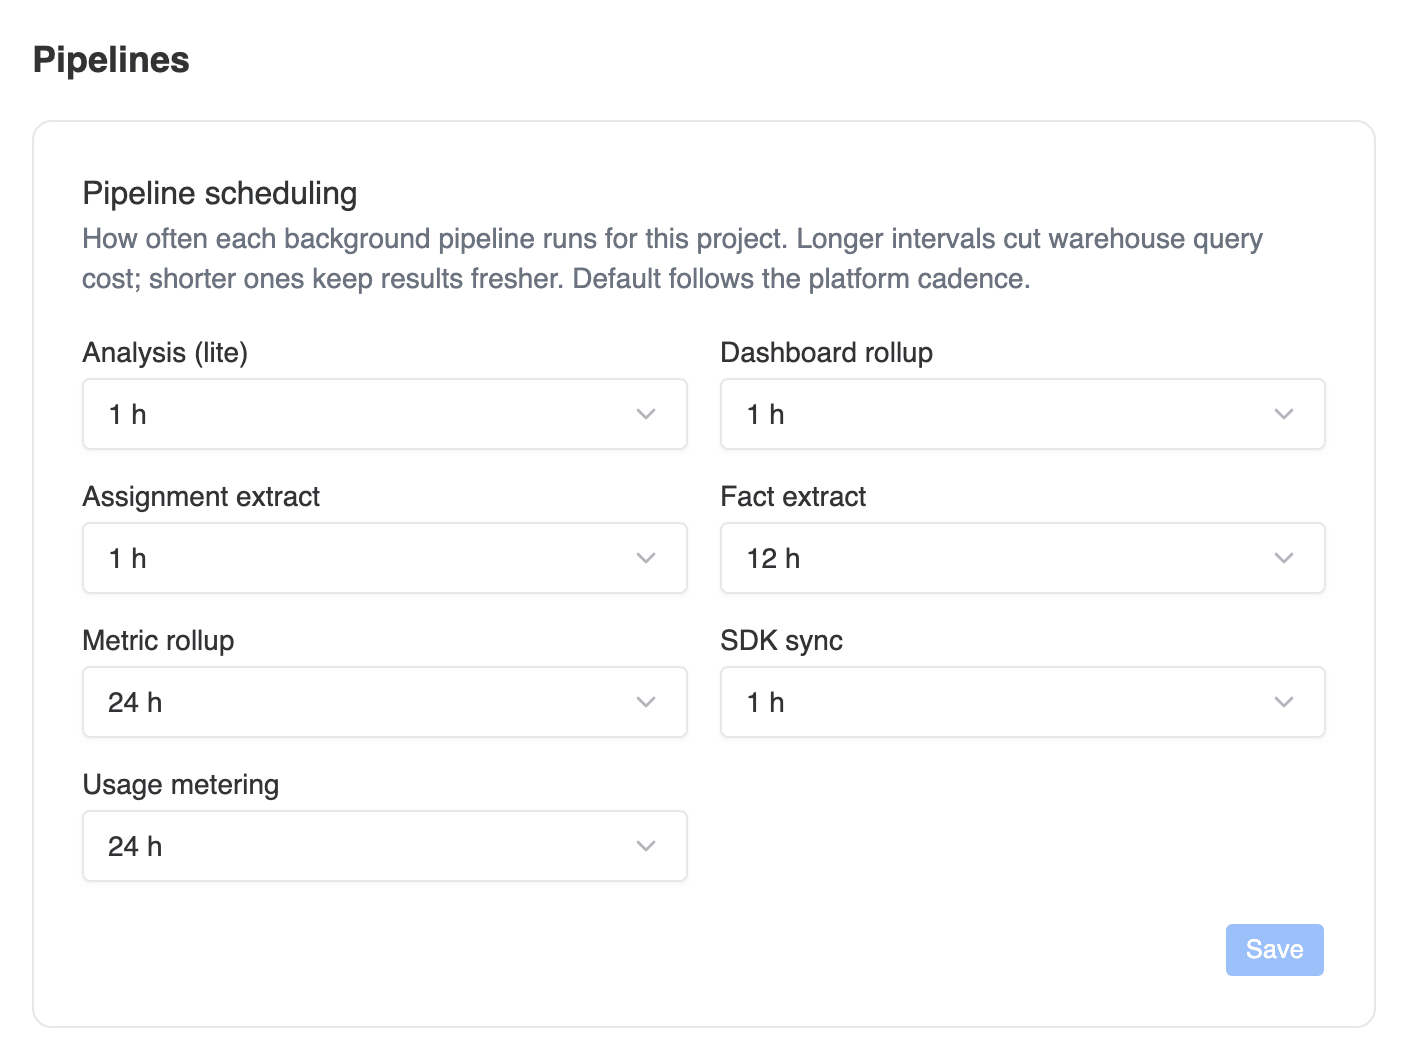 Every pipeline starts on **Default** — the platform cadence, shown in parentheses in the dropdown. Picking an explicit interval overrides the cadence for this project only; switching back to **Default** clears the override. Each pipeline offers a fixed set of intervals:
| Pipeline | What it does | Default | Intervals you can pick |
| ---------------------- | -------------------------------------------------------------------------------- | -------------------------------------------------------------------- | ---------------------------- |
| **Analysis (lite)** | Recomputes experiment results and policy health | Automatic — adaptive policies are analyzed more often than A/B tests | 5, 10, 15, 20, 30, 60 min |
| **Dashboard rollup** | Refreshes the aggregates behind dashboard charts | 5 min | 5, 10, 15, 20, 30, 60 min |
| **Assignment extract** | Extracts fresh assignment data — the shared input that rollups and analysis read | 5 min | 5, 10, 15, 20, 30, 60 min |
| **Fact extract** | Runs your fact definitions' SQL against the warehouse | 15 min | 15, 30 min; 1, 2, 4, 6, 12 h |
| **Metric rollup** | Recomputes metric aggregates and trends | 1 h | 1, 2, 4, 6, 12, 24 h |
| **SDK sync** | Writes SDK-emitted events into your warehouse | 5 min | 5, 10, 15, 20, 30, 60 min |
| **Usage metering** | Measures billable usage | 6 h | 1, 2, 3, 4, 6, 12, 24, 48 h |
One consistency rule is enforced: the **assignment extract** can't run less often than **dashboard rollup** or **analysis** when those also have explicit intervals — the extract feeds both, and a coarser extract would starve them of fresh data. The card flags the conflict and blocks the save until you resolve it.
Usage metering feeds [usage and billing](/dashboard/usage-and-billing); a longer interval only means the usage numbers refresh less often.
## SDK configuration
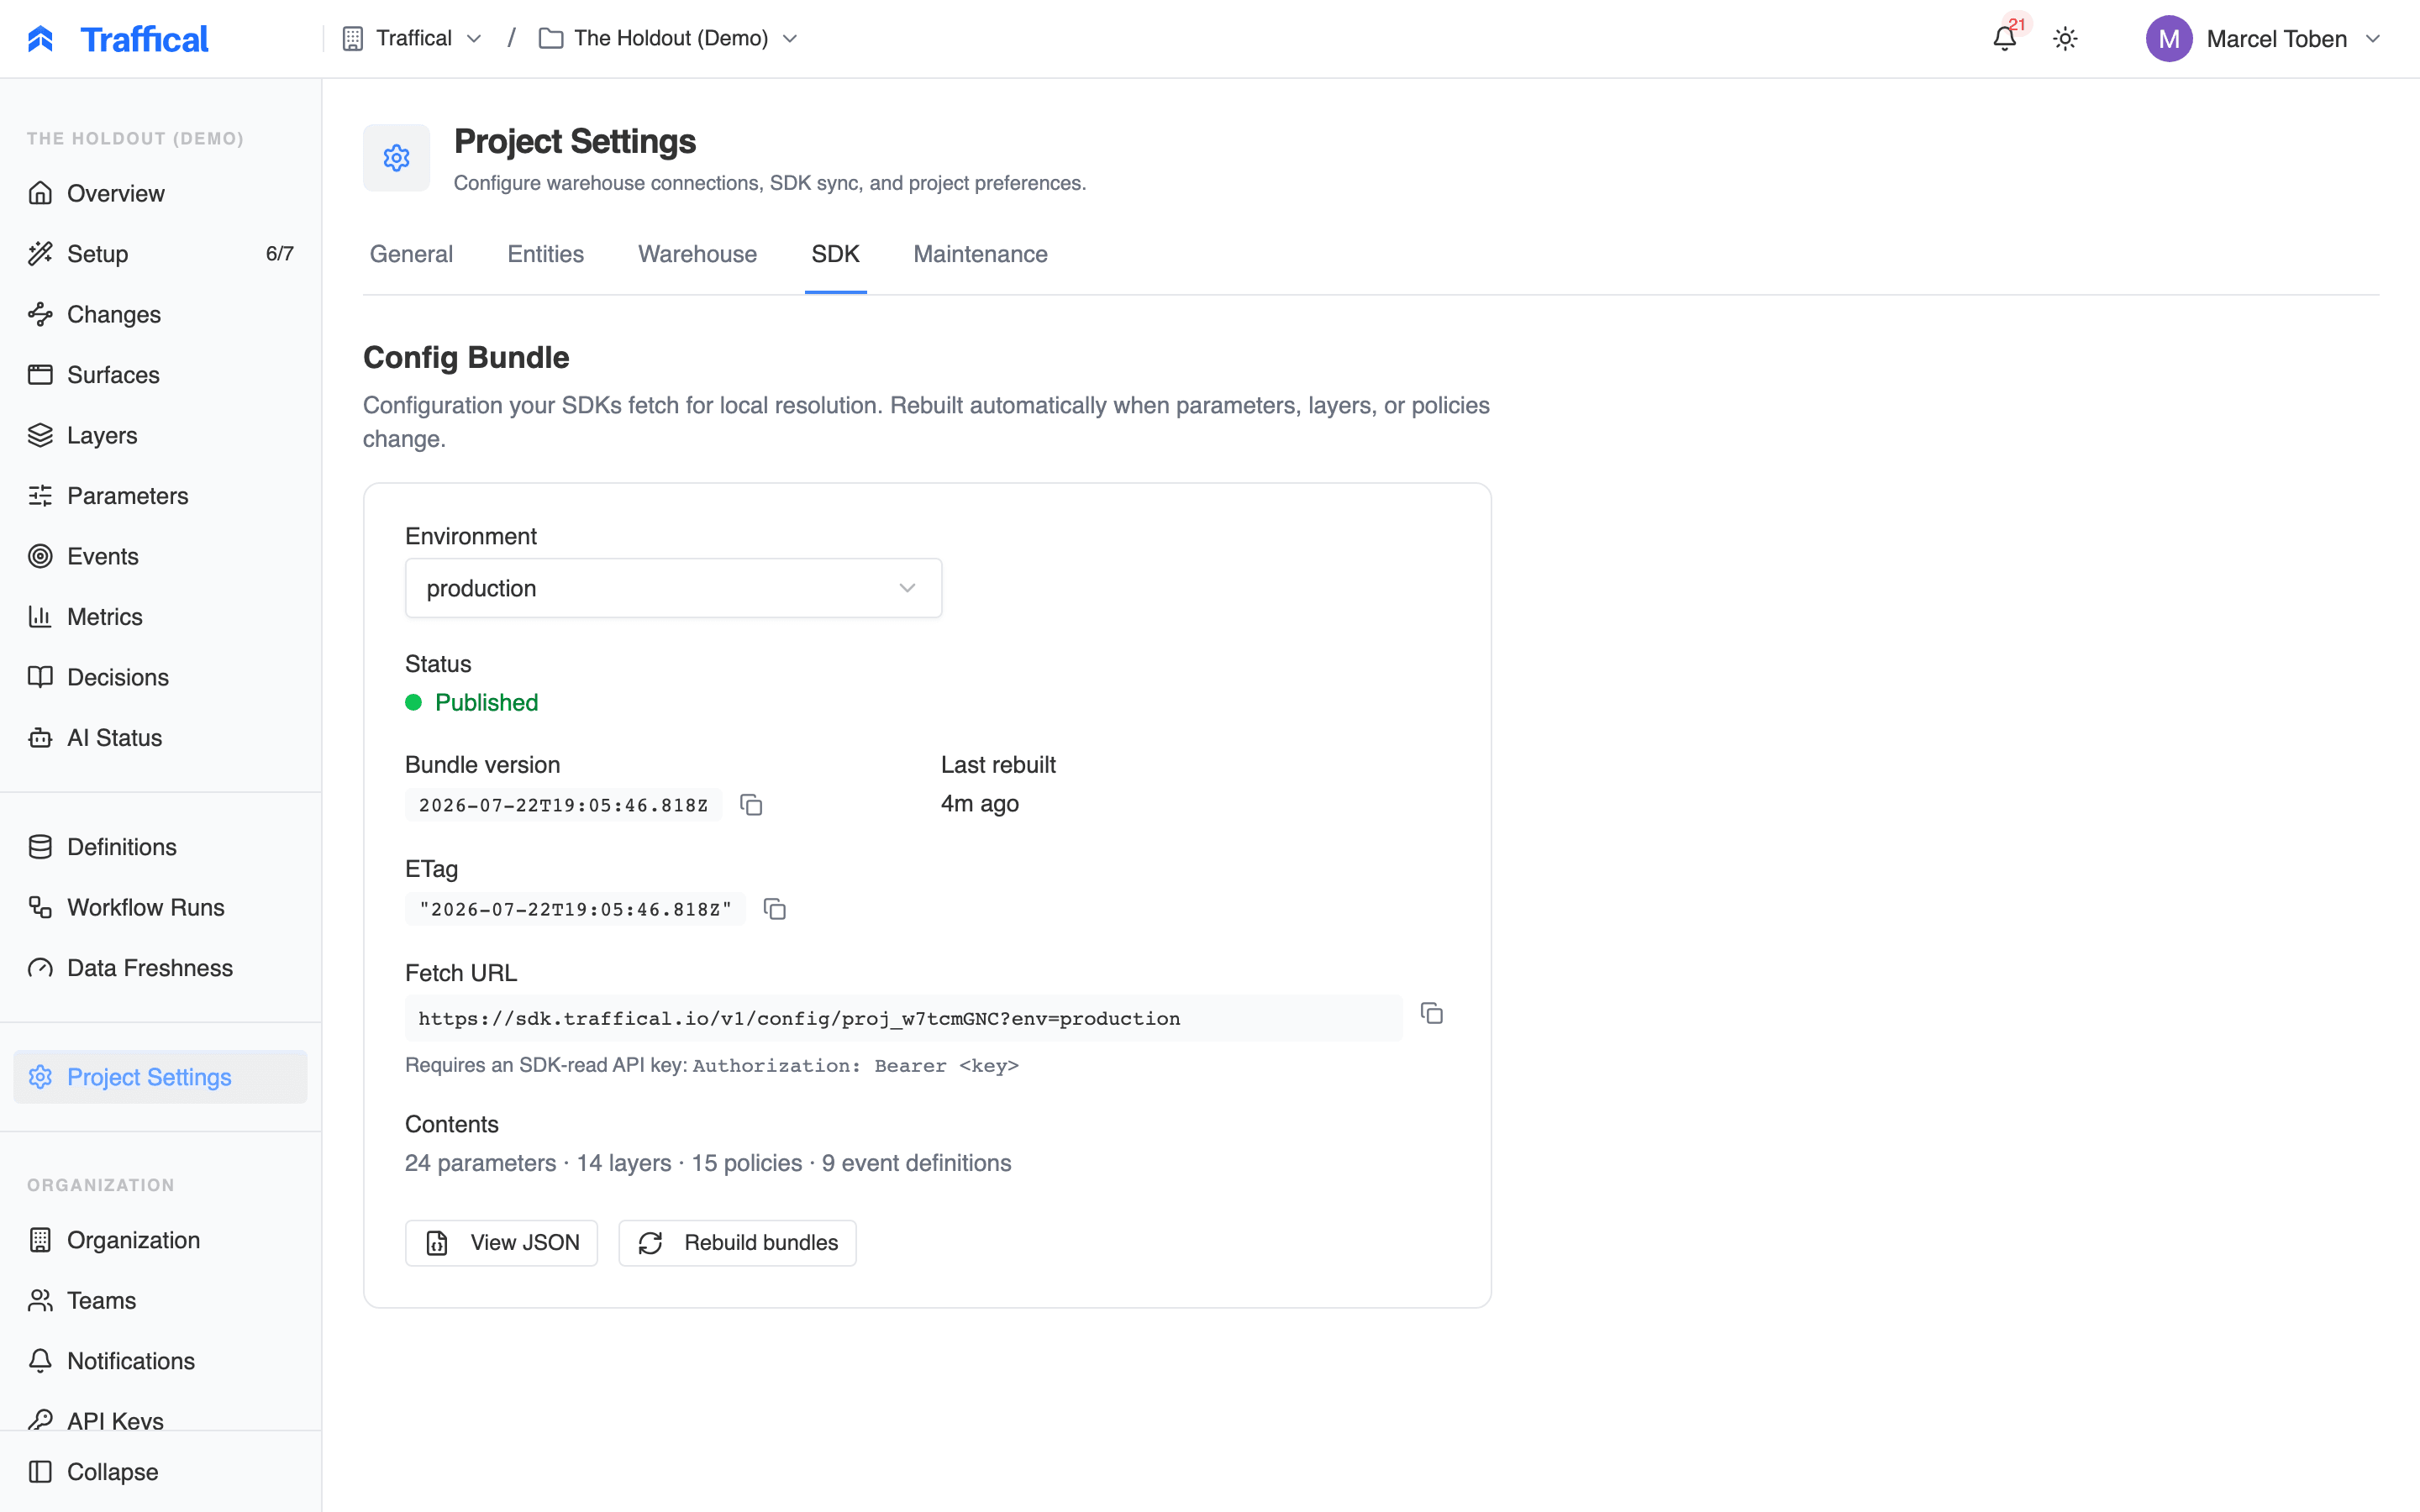
The **SDK** tab shows the state of the SDK-facing config bundle per environment — its current version and how many parameters, layers, and policies it carries — with actions to view the bundle JSON and force a rebuild. Below it, **SDK Event Sync** controls whether SDK-emitted events (exposures, decisions, track events) are written into your connected warehouse on a schedule, with sync status, last-run stats, and a manual trigger. Projects on the Traffical-managed warehouse ingest SDK events automatically, so the sync section only appears when you bring your own warehouse. The sync cadence itself lives in [pipeline scheduling](#pipeline-scheduling) above.
Every pipeline starts on **Default** — the platform cadence, shown in parentheses in the dropdown. Picking an explicit interval overrides the cadence for this project only; switching back to **Default** clears the override. Each pipeline offers a fixed set of intervals:
| Pipeline | What it does | Default | Intervals you can pick |
| ---------------------- | -------------------------------------------------------------------------------- | -------------------------------------------------------------------- | ---------------------------- |
| **Analysis (lite)** | Recomputes experiment results and policy health | Automatic — adaptive policies are analyzed more often than A/B tests | 5, 10, 15, 20, 30, 60 min |
| **Dashboard rollup** | Refreshes the aggregates behind dashboard charts | 5 min | 5, 10, 15, 20, 30, 60 min |
| **Assignment extract** | Extracts fresh assignment data — the shared input that rollups and analysis read | 5 min | 5, 10, 15, 20, 30, 60 min |
| **Fact extract** | Runs your fact definitions' SQL against the warehouse | 15 min | 15, 30 min; 1, 2, 4, 6, 12 h |
| **Metric rollup** | Recomputes metric aggregates and trends | 1 h | 1, 2, 4, 6, 12, 24 h |
| **SDK sync** | Writes SDK-emitted events into your warehouse | 5 min | 5, 10, 15, 20, 30, 60 min |
| **Usage metering** | Measures billable usage | 6 h | 1, 2, 3, 4, 6, 12, 24, 48 h |
One consistency rule is enforced: the **assignment extract** can't run less often than **dashboard rollup** or **analysis** when those also have explicit intervals — the extract feeds both, and a coarser extract would starve them of fresh data. The card flags the conflict and blocks the save until you resolve it.
Usage metering feeds [usage and billing](/dashboard/usage-and-billing); a longer interval only means the usage numbers refresh less often.
## SDK configuration
The **SDK** tab shows the state of the SDK-facing config bundle per environment — its current version and how many parameters, layers, and policies it carries — with actions to view the bundle JSON and force a rebuild. Below it, **SDK Event Sync** controls whether SDK-emitted events (exposures, decisions, track events) are written into your connected warehouse on a schedule, with sync status, last-run stats, and a manual trigger. Projects on the Traffical-managed warehouse ingest SDK events automatically, so the sync section only appears when you bring your own warehouse. The sync cadence itself lives in [pipeline scheduling](#pipeline-scheduling) above.
 ## Warehouse
The **Warehouse** tab configures the warehouse Traffical reads from for [warehouse-native](/concepts/warehouse-native) metrics. Choose **Traffical Native** (the managed warehouse) or bring your own — PostgreSQL, BigQuery, Snowflake, Databricks, or ClickHouse — and enter credentials. On a saved connection you can **Test Connection**, replace credentials, or delete the connection; credentials are stored securely and hidden after saving. See [Connectors](/connectors/overview) for what each warehouse needs.
## Warehouse
The **Warehouse** tab configures the warehouse Traffical reads from for [warehouse-native](/concepts/warehouse-native) metrics. Choose **Traffical Native** (the managed warehouse) or bring your own — PostgreSQL, BigQuery, Snowflake, Databricks, or ClickHouse — and enter credentials. On a saved connection you can **Test Connection**, replace credentials, or delete the connection; credentials are stored securely and hidden after saving. See [Connectors](/connectors/overview) for what each warehouse needs.
 ## Entities
The **Entities** tab lists the project's randomization units. Each entity declares the context field the SDK reads to identify a unit (e.g. `userId`, `merchantId`) and its key type — string, integer, or UUID. One entity is the **project primary**: [layers](/concepts/layers) that don't name an entity explicitly inherit it. You can create entities here and promote one to primary; Traffical rebuilds the config bundle when the primary changes, so SDKs pick up the new layout on their next fetch.
## Maintenance
The **Maintenance** tab runs project-level operations — data backfills, integrity audits, and diagnostics. Pick an action, review its labels (**read-only** or **read-write**, **idempotent** or **destructive** — non-idempotent actions get an extra warning), and execute; the result and full output appear inline. If something looks wrong with your data, start with the read-only audits — see [Troubleshooting](/reference/troubleshooting).
## Entities
The **Entities** tab lists the project's randomization units. Each entity declares the context field the SDK reads to identify a unit (e.g. `userId`, `merchantId`) and its key type — string, integer, or UUID. One entity is the **project primary**: [layers](/concepts/layers) that don't name an entity explicitly inherit it. You can create entities here and promote one to primary; Traffical rebuilds the config bundle when the primary changes, so SDKs pick up the new layout on their next fetch.
## Maintenance
The **Maintenance** tab runs project-level operations — data backfills, integrity audits, and diagnostics. Pick an action, review its labels (**read-only** or **read-write**, **idempotent** or **destructive** — non-idempotent actions get an extra warning), and execute; the result and full output appear inline. If something looks wrong with your data, start with the read-only audits — see [Troubleshooting](/reference/troubleshooting).
 ## Archiving and deleting
At the bottom of the **General** tab, the danger zone holds **Archive Project**. Archiving hides the project from the project list and stops all background jobs — optimization, metric refreshes, syncs, rollups. It's blocked while any policy is running: complete or pause running policies first, so archiving never silently kills a live experiment.
Archiving is reversible: restore the project any time from the organization page under the **Archived** filter. Permanent deletion is a separate, second step — only archived projects can be deleted, from that same organization page, and it requires typing the project's name to confirm. Deletion removes all configuration — environments, parameters, policies, metrics, definitions, and decision log history — and can't be undone. Already-ingested event data and any tables synced into your warehouse are not removed.
## Next steps
The wizard your change defaults feed into.
Runs, freshness, and what each pipeline stage produces.
How the target MDE drives runtime estimation.
What usage metering measures.
## Archiving and deleting
At the bottom of the **General** tab, the danger zone holds **Archive Project**. Archiving hides the project from the project list and stops all background jobs — optimization, metric refreshes, syncs, rollups. It's blocked while any policy is running: complete or pause running policies first, so archiving never silently kills a live experiment.
Archiving is reversible: restore the project any time from the organization page under the **Archived** filter. Permanent deletion is a separate, second step — only archived projects can be deleted, from that same organization page, and it requires typing the project's name to confirm. Deletion removes all configuration — environments, parameters, policies, metrics, definitions, and decision log history — and can't be undone. Already-ingested event data and any tables synced into your warehouse are not removed.
## Next steps
The wizard your change defaults feed into.
Runs, freshness, and what each pipeline stage produces.
How the target MDE drives runtime estimation.
What usage metering measures.