

SDK requests fail with 401 or 403
Symptom — every SDK call (or a direct API call) returns401 or 403. All API errors share one shape, so start by reading the code and message:
Fix — open your organization’s API Keys page (from the account menu) and check the key’s type. SDKs need a publishable (
traffical_pk_...) or server-side (traffical_sk_...) SDK key; management and admin keys don’t reach SDK endpoints, and SDK keys don’t reach the control plane — the key types table shows the split. Server-side resolution (/v1/resolve, /v1/decide/*) additionally needs a server-side key, not a publishable one. If the key is expired or revoked, mint a new one — or rotate it, which issues a replacement and keeps the old one valid for 7 days. Keys are cheap and can be pinned to a single project.
Parameters resolve to their defaults
Symptom —get() returns the default value for everyone; no one sees a variation.
Likely causes, in the order to check them:
- The bundle was never fetched. If the config request fails, SDKs fall back to code defaults silently. Check the network tab (or server logs) for
GET /v1/config/:projectId. A404withBundle not found for <projectId>/<env>means the project ID or environment name is wrong — the env defaults toproduction, so a typo’d or unpublished environment 404s. - Wrong environment. Bundles are per project and environment. If you configured overrides in one environment but the SDK fetches another, you’ll see that other environment’s defaults.
- The served bundle is a stale copy. A
200response carrying theX-Traffical-Bundle-Stale: trueheader means the config store was briefly unavailable and Traffical served the last known bundle — a change you just published may not be in it. This resolves itself within moments; the stale response carries a shorter cache TTL so clients revalidate aggressively. - The policy isn’t running. Only policies in the
runningstate — and inside their start/end schedule window, if one is set — are included in the bundle. Draft, paused, and completed policies resolve to defaults. Check the policy’s state badge on its detail page. - The unit key is missing from the context. If the evaluation context doesn’t include the project’s unit key field (for example
userId), the layer is skipped entirely: no bucket, no policy match, defaults for every parameter in it — and no exposure event is recorded. In multi-entity projects, a layer randomizing on a different entity needs that entity’s key in the context. - Targeting conditions don’t match. A policy whose conditions don’t match the context is passed over. Test with a context you know should qualify.
curl the config endpoint with your SDK key) and look inside: is the parameter there with the value you expect, and is the policy present in its layer? If the policy is missing, it isn’t running. If it’s present, the problem is on the client side — context, environment, or a failed fetch.
Events aren’t showing up
Symptom — your code callstrack(), but the Events page shows no volume and metrics stay flat.
Likely causes
- The key can’t write. Sending events needs an SDK key — publishable or server-side. A management or admin key is refused with
403, as is a legacy key lackingsdk:write(SDK write scope required). - Schema enforcement rejected them. If the event’s definition has
schemaEnforcement: reject, an event violating the property schema is dropped and reported in the response’svalidationErrorsarray withSchema validation failed: .... Inwarnmode the event is stored and the violations appear inschemaWarningsinstead — so “warn shows data, reject shows nothing” is the tell. See property schemas. - The event name doesn’t match its definition. Metrics aggregate a specific event definition by exact name. A typo’d name (
purchase_completedvspurchase) doesn’t error — it accumulates as a separate auto-discovered event while the metric it was meant to feed stays flat. - The event is structurally invalid. Events missing
typeorunitKeyare skipped individually and reported invalidationErrors; the rest of the batch is still accepted.
POST /v1/events response, which tells you exactly what happened: accepted is the count that passed validation, validationErrors lists dropped events by batch index, schemaWarnings lists stored-but-violating track events. Then open the Events page sorted by recent volume — a misspelled event shows up there as an unexpected auto-discovered row.
A policy shows no results
Symptom — the policy is running and assignment events are flowing, but the results section is empty or never reaches a verdict. Likely causes- No goal metric attached. Results are computed per attached metric; a policy with none has nothing to analyze. For adaptive policies this also stalls optimization — the health view reports
Optimizer has no reward source: no primary metric attached. On the policy’s detail page, open the metrics panel and click Attach Metrics (how). - Not enough enrolled units yet. Guardrail evaluation reports
insufficient_datafor any treatment allocation with fewer than 30 units, and early confidence intervals — especially sequential ones — are wide by design. This is the system refusing to call it early, not a malfunction. Measurement progress shows how far along the measurement is and a runtime estimate. - You’re ahead of the analysis schedule. Health and SRM checks refresh on a fast lane (every 5–15 minutes), but metric results — significance, lifts — are recomputed on the full analysis run, typically every two hours. An event sent seconds ago won’t move a result yet, and flat results half an hour after launch are normal. Check freshness and recent runs on the Pipeline page.

Policy health surfaces most measurement problems before you go digging
A sample-ratio mismatch (SRM) warning
Symptom — the policy health view warnsSample ratio drifting or fails with Sample ratio mismatch.
What it means — the observed traffic split across allocations doesn’t match the configured split, tested with a chi-squared check. Warn fires at p < 0.01; fail requires p < 0.001 and an absolute deviation over 0.1 percentage points, so huge-sample statistical blips don’t page you. An SRM is serious: it means assignment or exposure logging is selectively losing users, and results computed on top of it are not trustworthy.
Likely causes
- Targeting or allocation edits mid-flight. Changing weights or conditions on a running policy shifts who lands where from that moment on, while the window still contains the old regime. (Adaptive policies are handled for you: the check re-baselines at each optimizer rebalance, so a legitimate rebalance won’t trip it.)
- Caching. Clients holding an old config bundle keep serving the old split. Long-lived server processes that never refresh, or an aggressive CDN in front of your own config fan-out, are the usual suspects.
- Differential exposure loss. One allocation loses its exposure events more than the other — a redirect treatment dropping users before the SDK flushes, an allocation that crashes a webview, ad-blockers firing on one page layout but not the other.
A guardrail is breaching
Symptom — the health view showsN guardrail breach(es), or a change was paused and you didn’t do it.
What the severities do — a guardrail’s severity is set in the measurement protocol and decides what a breach triggers:
warningflags the change for human review. Nothing is stopped automatically.blockingis enforced: when a blocking guardrail turns failing on a running phase, the monitor applies the phase’s armed breach action — pausing the policy by default; reverting or merely recording only when configured — and writes a decision record citing the evidence. If a change paused itself, this is why; the decision record names the guardrail.
insufficient_data, means the allocation has fewer than 30 units — the guardrail hasn’t been evaluated yet and surfaces as a health warning, not a breach.
Fix — open the decision record to see the metric, threshold, and measured value. If the regression is real, the system did its job — revert or iterate. If the guardrail is misconfigured (wrong direction, a threshold entered as 50 when you meant 0.5%), fix the protocol: certify a new version and re-resolve affected plans.
Warehouse connection failures
Symptom — Test Connection fails in Settings → Warehouse, or pipeline runs start failing after working fine. Likely causes
Fix — Test Connection opens a real session and runs a trivial query, so it isolates credentials and network from SQL problems: if the test fails, fix access first; if the test passes but runs fail, the problem is in a definition’s SQL or in permissions on a specific schema. The credentials need read on your source tables plus read + write on the dedicated Traffical schema — the exact grants per warehouse are on each connector page.
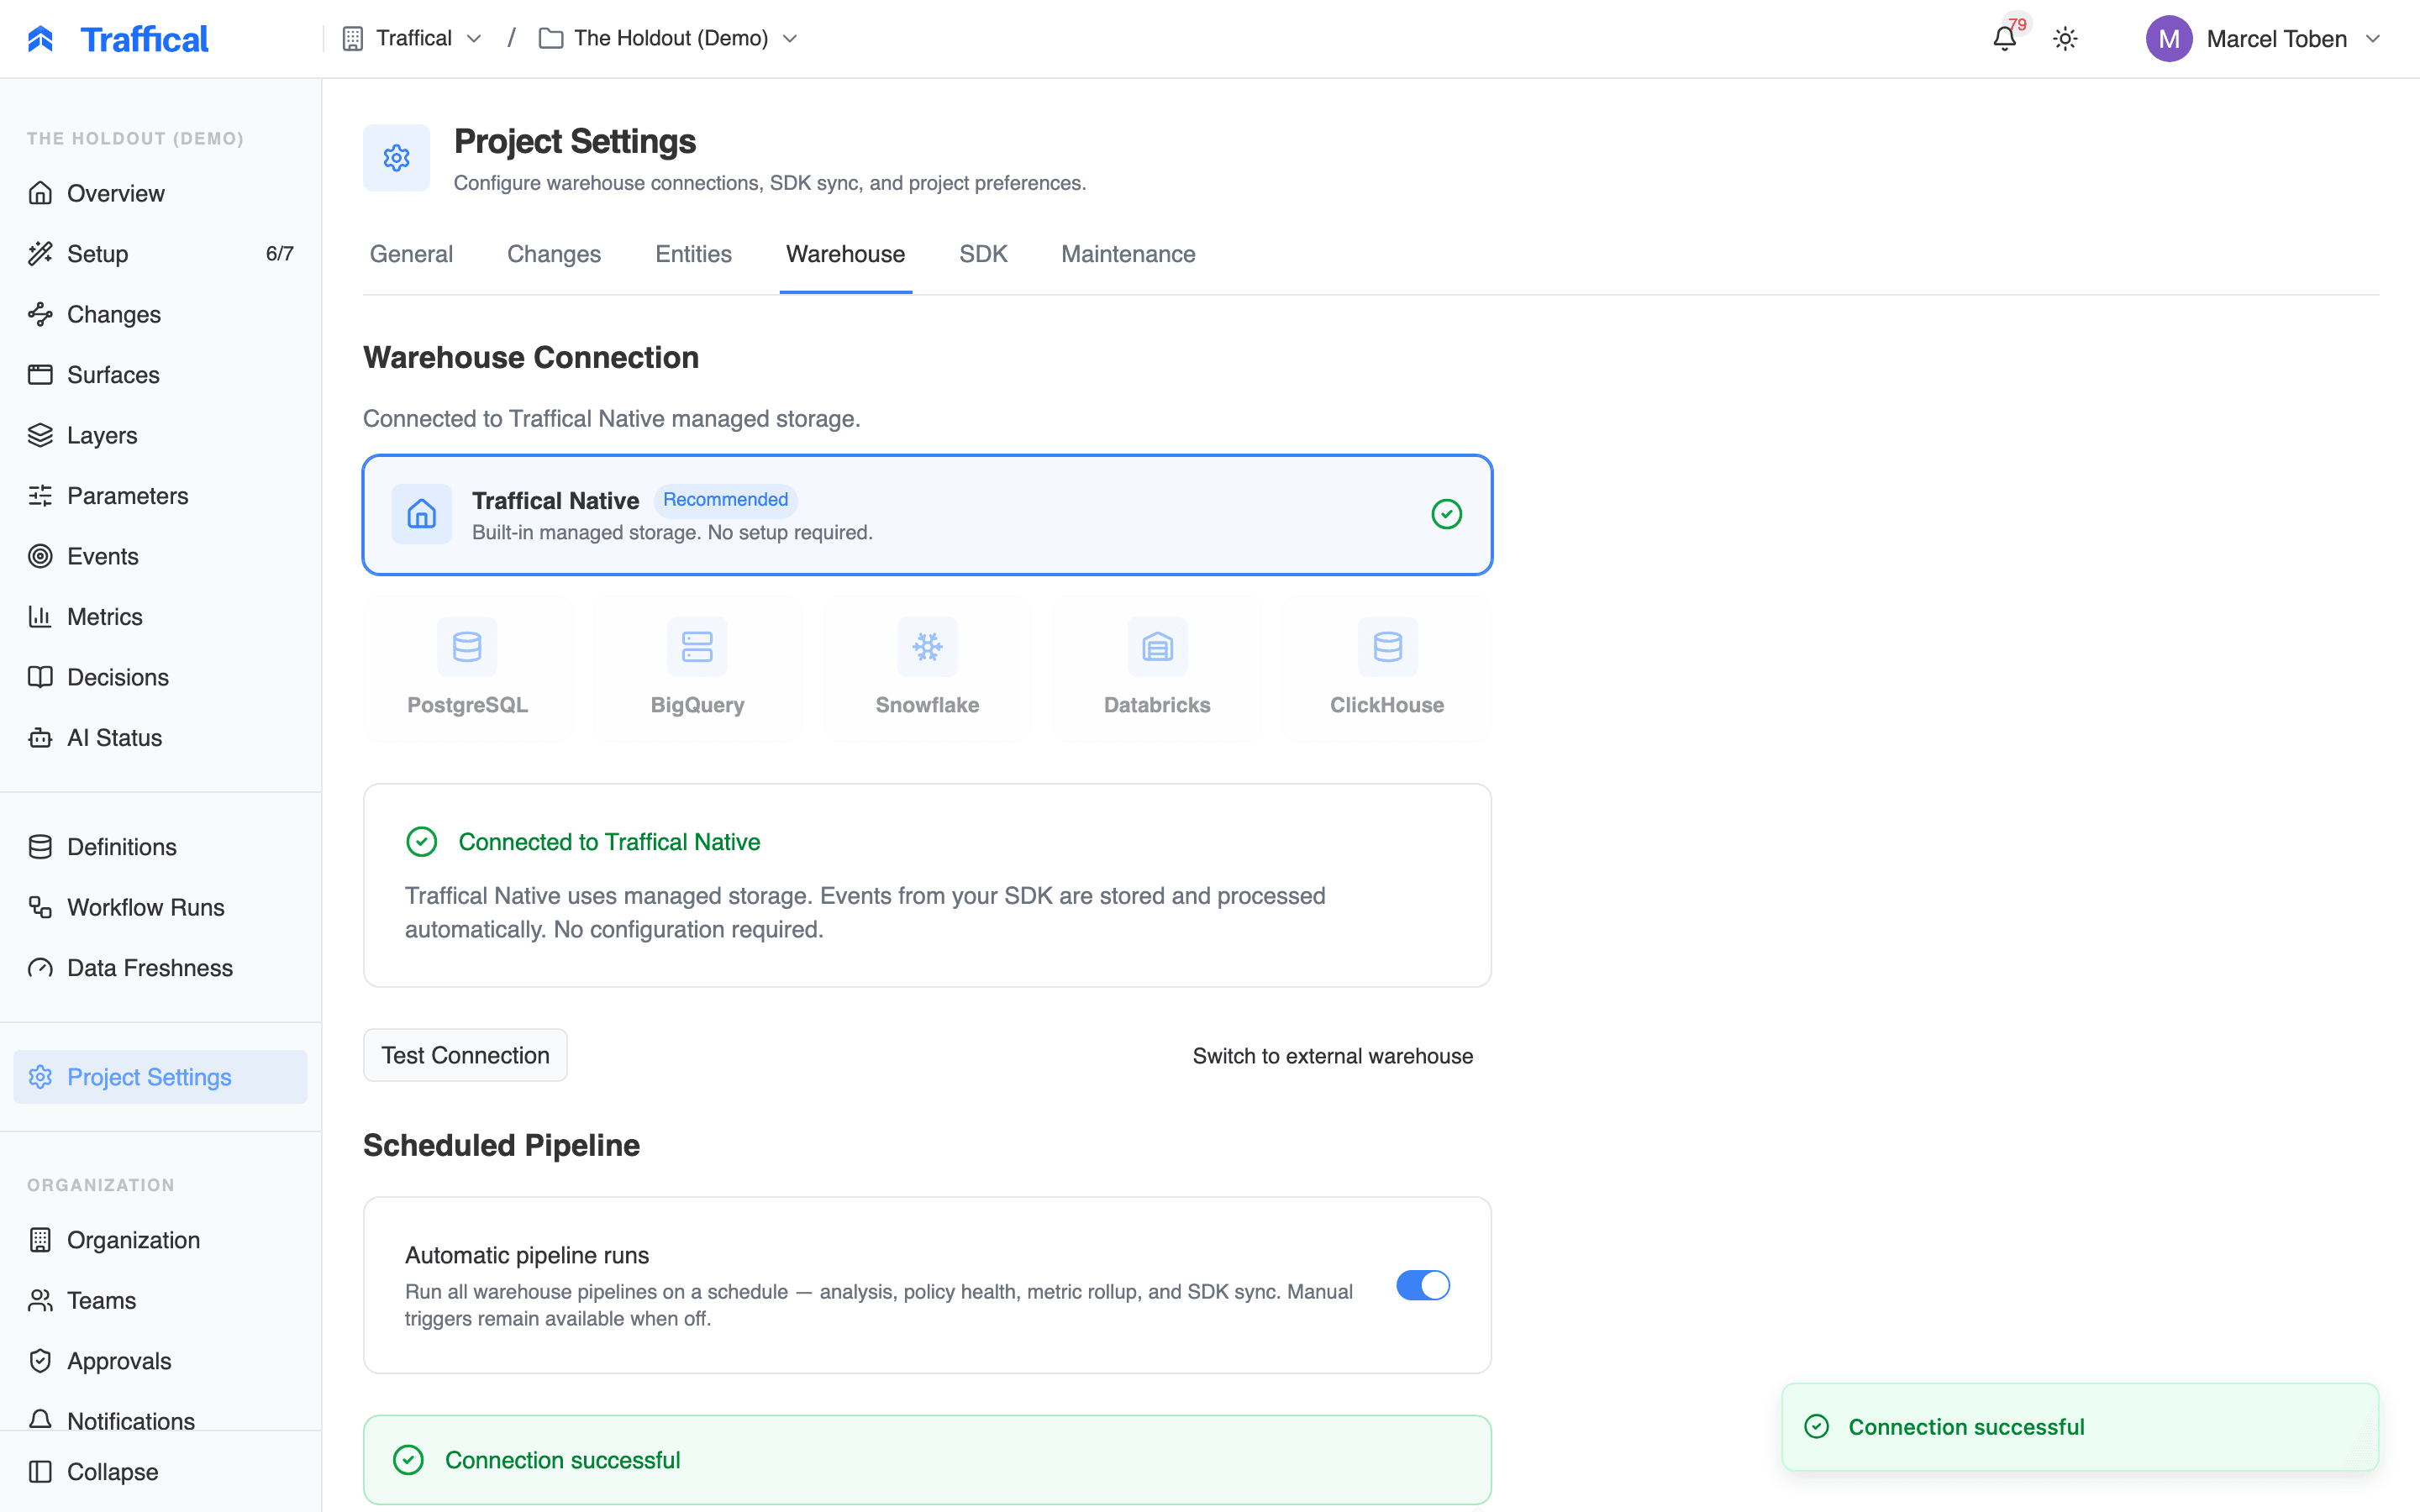
Test Connection isolates credential and network problems from SQL problems
A change can’t start traffic
Symptom — the start action on a change is blocked in the dashboard, or an agent’srequest_transition comes back refused.
What’s happening — every path that starts traffic passes the same start gate: a change cannot expose traffic without an approved measurement plan. Three cases:
- No certified protocol covers the change. The start is blocked with: “No certified measurement protocol matches this change — a human must approve a measurement plan before exposing traffic.”
- Certified coverage, but not auto-approvable. Auto-approval requires all of: low risk class, a plan resolved entirely from certified protocols, and zero unresolved risks. Any medium, high, or critical change — and any plan carrying a coverage gap — waits for a human. High- and critical-risk changes never start without a person signing off; see risk classes.
- The plan is structurally invalid. Multiple primary metrics with no designated objective is a hard block even for a human approver — the plan must be disambiguated first.

The Plan tab shows exactly why a start is blocked and what approving it requires
MCP client can’t connect
Symptom — an agent can’t reach the MCP server, sees fewer tools than expected, or has its transitions refused. Likely causes- Wrong key type. SDK keys — publishable (
traffical_pk_...) and server-side (traffical_sk_...), including the keys the CLI provisions into.traffical/.env— cannot reach the control plane at all and get a403 FORBIDDEN. Use a management key (traffical_mk_...) or admin key (traffical_ak_...), or the OAuth flow. - Missing
mcp:invoke. A management key without that permission returns403 Required permission: mcp:invoke. It is not part of the default management-key preset — grant it explicitly when creating the key. - OAuth token minted for the wrong resource. Tokens are audience-bound: a token minted for anything other than the MCP resource gets a
401whoseWWW-Authenticateheader points at the OAuth discovery document. Clients that follow standard discovery recover automatically; re-run your client’s auth flow (/mcpin Claude Code). - Write tools missing from
tools/list. The tool list is scope-filtered — a token withoutchanges:propose/changes:operate/defaults:promotesimply never sees the write tools. This is a token-scope issue, not a server outage. - Transitions rejected outright. MCP write mode is off (the default) or set to
advisory. Inoff,create_changestill authors drafts but its start leg is refused; inadvisory, every transition is capped at a proposal for human review. That’s governance working as designed, not a failure.
whoami first: it confirms the token works and which projects it can reach. If it fails, fix the key or the OAuth flow before anything else. If read tools work but writes don’t, check the key’s permissions on the API Keys page, then the organization’s write mode.
Still stuck?
FAQ
Short answers to the questions that aren’t failures.
Policy health
The six runtime checks and how each is computed.
Notifications
Get told about breaches and stalls before users notice.
API overview
Key scopes, error codes, and rate limits in one place.
code and message usually identify the problem immediately.