

Measurement progress on a running policy
The target effect
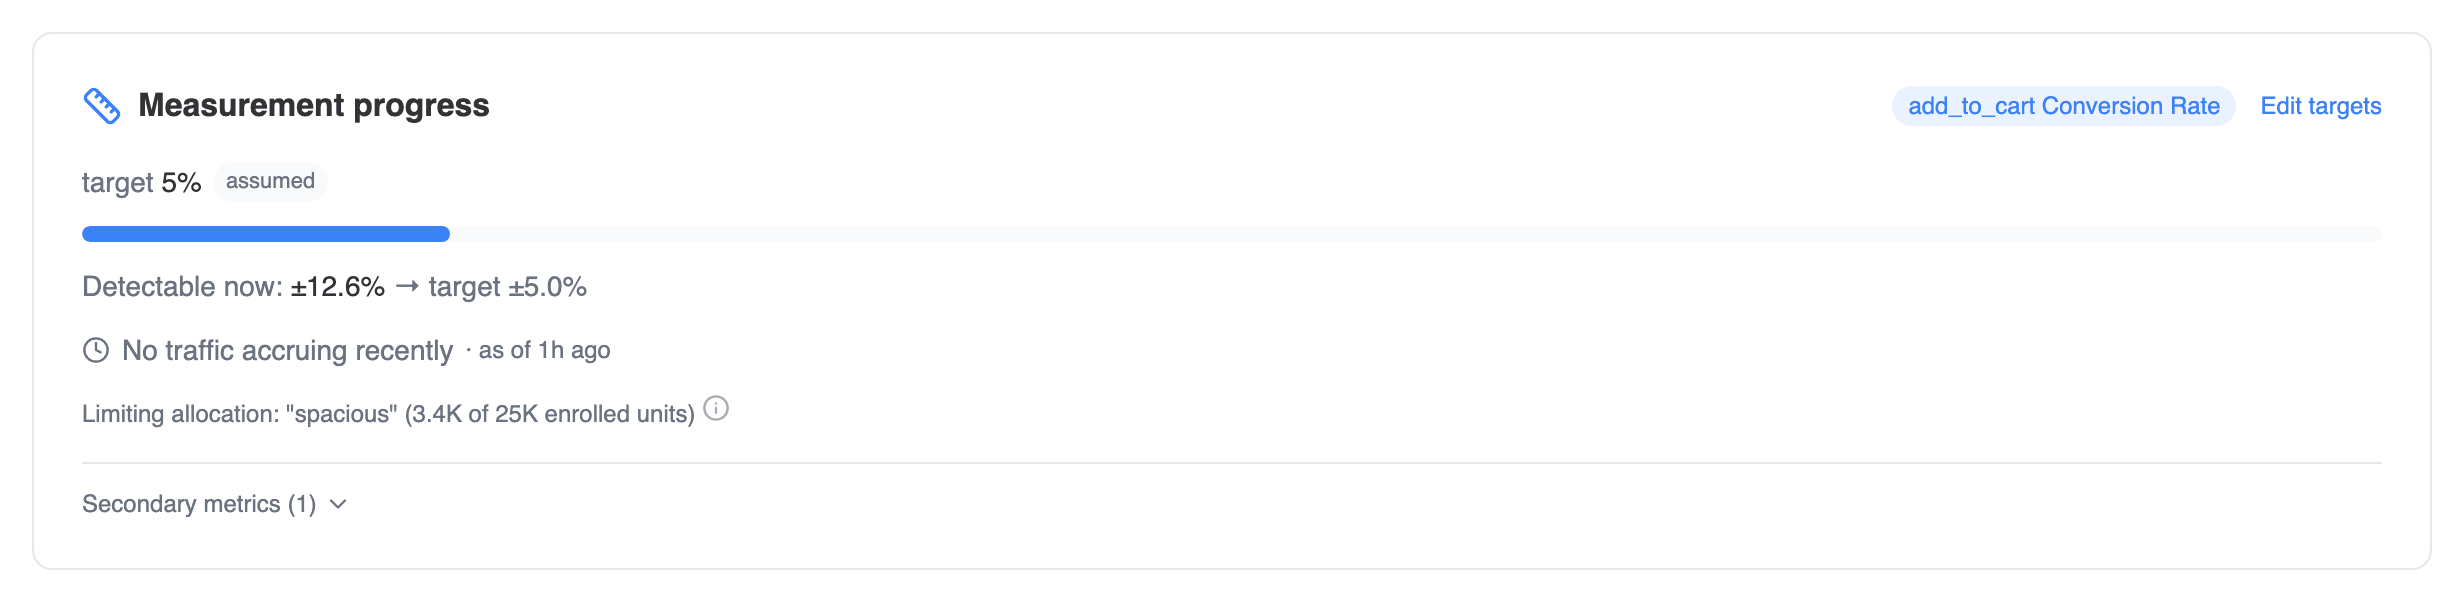
Progress needs a destination: the target MDE (minimum detectable effect) — the smallest relative lift you care about detecting, such as 5%. A smaller target means a more sensitive measurement and a longer runtime. You rarely have to set it per policy. Traffical resolves the target from the most specific place it’s been declared, and the card shows a chip naming where the value came from:- Protocol — the policy was launched through a change governed by a measurement protocol whose approved plan pins the design targets (MDE, and optionally confidence and power). The governance commitment wins for the primary metric.
- Policy override — a target set on the metric attachment for this specific policy.
- Metric default — a default target on the metric definition itself, shared by every policy that uses it.
- Project default — the project-wide default in the project’s analysis settings.
- Assumed — none of the above is set, so a 5% relative MDE is assumed.
What you can detect right now
The other half of the readout is “Detectable now: ±X%” — the smallest relative lift the measurement could reliably detect with the data collected so far. There’s no separate power calculation behind this number. It’s derived directly from the width of the current confidence interval on the lift: a wide interval means only large effects are detectable yet; as data accrues the interval tightens and the detectable effect shrinks toward your target. Because it comes from the same interval the results table shows, it automatically reflects everything that shapes your analysis — variance reduction, outlier capping, and sequential testing included.How the progress bar works
Statistical precision improves with the square root of sample size — to detect an effect half as large, you need four times the data. The progress bar uses that quadratic scale, comparing the target to what’s detectable now. If your target is 5% and you can currently detect ±10%, you’re at 25% progress, not 50% — an honest reflection of the data still to come. Progress is capped at 100%, with an explicit terminal state: when the detectable effect reaches your target, the bar turns green and reads Target reached. At that point the measurement is powered for the effect you asked about — whatever the result says now, you can trust it at your chosen sensitivity.“Target reached” doesn’t mean the result is significant. It means the measurement can now reliably detect an effect of the target size — including confidently concluding there isn’t one.
Estimated time remaining
From the gap between detectable-now and the target, Traffical computes how many more enrolled units each allocation needs, then divides by each allocation’s recent accrual rate to produce “~N days remaining” and an estimated completion date. When the measurement has an entry point attached, the sample is qualified units — enrolled units with a qualifying fact at or after first assignment — and the required-sample and time-remaining math run on qualified units instead. Two things keep the estimate honest:- It carries an “as of” stamp. Estimates refresh on every analysis run (typically every two hours), and the card shows when the numbers were last computed. On a paused policy the last estimate is kept but the countdown is suppressed — “Paused — estimates frozen”.
- It never fabricates a date. If no traffic has accrued recently, you’ll see “No traffic accruing recently” instead of a number. If traffic is flowing but the target is effectively out of reach at current rates, the card says “>10 years at current traffic” — a prompt to raise the target, widen the audience, or rethink the metric rather than wait.
Unequal splits and the limiting allocation
Progress is computed per treatment-versus-control pair, and the headline follows the slowest pair. With a 90/10 split, the small allocation dominates the interval width — the measurement is only as far along as its most starved comparison, and the required sample is computed at the split you actually configured, not an assumed 50/50. When a policy has more than two allocations, the card names the limiting allocation and shows how many units it has versus how many it needs, so you can see exactly which comparison is holding the measurement open.With sequential testing
When sequential testing is on, the confidence interval is an anytime-valid sequence — wider than a fixed-horizon interval at any single look, which is the price of unlimited peeking. Progress accounts for this directly: the detectable-now effect is read off the (wider) sequence, and the required sample size is found by asking the same interval shape how many units it takes to tighten to your target. No optimistic fixed-horizon shortcut — the ETA reflects the test you’re actually running.Planning before launch
A draft policy has no data, so the card becomes a what-if planner: enter your expected baseline rate (for conversion metrics) and a target MDE — prefilled from your configured defaults, with a chip showing the source — and it returns the enrolled units needed per allocation and in total.
What-if planner on a draft policy
Guardrail metrics
Guardrails don’t need a target MDE — their threshold is the target. A guardrail with a relative threshold (say, “flag if this drops more than 2%”) is tracked against that size: its row in the metric results reads Underpowered until the measurement can reliably distinguish a real 2% regression from noise, then shows a Powered check. Guardrails don’t appear on the progress card itself. Guardrails with absolute thresholds bound a level rather than a lift, so they aren’t tracked this way.Adaptive and contextual policies
For adaptive policies, progress tracks the leader versus control — the comparison whose measured significance actually gates completion. That’s deliberate: the optimizer starves losing allocations by design, so their comparisons would never finish, and holding the measurement open for them would be misleading. Contextual policies get no runtime estimate at all. When the winner varies per context, there is no single “done” — the card shows the target for reference and leaves it there.After the test ends
A completed policy shows a retrospective instead of a bar:
Measurement summary on a completed policy
This measurement could reliably detect effects of ±3.2% or larger on Checkout conversion (80% power, 95% confidence).That sentence is the honest summary of what the test could and couldn’t see. If the final result was “no significant effect” but the test could only detect ±12%, a meaningful smaller effect may simply have been invisible — context that matters when the result feeds into impact reporting.
Next steps
Sequential testing
Anytime-valid intervals — why they’re wider and what that buys you.
Measurement protocols
Pin design targets (MDE, confidence, power) as a governance commitment.
Significance & metric types
How the confidence intervals behind this readout are computed.
Impact methodology
How shipped wins roll up into reported impact.